
Experiment 2 - NMR Spectroscopy
Objective
-
•to understand the important role of nuclear magnetic resonance spectroscopy in the study of the structures of organic compounds
-
•to develop an understanding of the significance of the number, positions, intensities, and splitting of signals in nuclear magnetic resonance spectra
-
•to be able to assign structures to simple molecules on the basis of nuclear magnetic resonance spectra
Introduction
Spectroscopic methods are one of the more useful ways of structure determination in Organic Chemistry. Usually, one will do a combination of several methods in order to elucidate the structure. Three types that one commonly encounters in organic chemistry are Nuclear Magnetic Resonance (NMR), Infrared (IR), and Mass Spectral (MS) analysis. Infrared spectroscopy was introduced in the first semester organic lab. As the name implies Nuclear Magnetic Resonance Spectroscopy involves applying an external magnetic field to bring the nucleus of certain atoms (1H or 13C) into resonance (equilibrium between a ground and an excited state). In each case, all the nuclei being either hydrogen or carbon will resonate at the same effective field strength, but depending on the environment, the applied field strength may differ. For example, in a video game, it may take one hit to liquidate the villain (effective); however, depending on the environment (buildings, woods, etc.), one may have to apply more "shots" to produce this one effective hit. In the plot produced by the spectrometer, the applied field (or a percentage of it) is plotted against the absorption (the intensity). There are four important outcomes that we shall consider for 1HNMR.The Number of Signals Present
The number of signals will give an indication of the number of different types of hydrogens that are present. Protons in the same environment are chemically equivalent and will resonate at the same applied strength. Those in a different environment will require a different applied field and therefore will appear at a different position in the spectrum. Examples:- CH - 1 signal, all H's are in the same environment.
- CH3CH3 - 1 signal, all H's are in the same environment.
- CH3CH2CH3 - 2 signals, the two sets of CH3 hydrogens are in the same environment, but are different from the CH2 hydrogens.
- CH3-C=O OCH3 - 2 signals, the two CH3 groups are in different environments. One is attached to the C=O, and the other is attached to oxygen.
The Position of the Signal: Chemical Shift
The shift (chemical shift) is the exact place on the chart where the nucleus absorbs. Shifts are measured in parts per million (ppm), i.e., a percentage of the applied magnetic field. A typical 1H NMR scale is from 0 to 14 ppm, and in most cases, an internal standard (tetramethylsilane, TMS) is added and is used as the zero reference point. The chemical shift is dependent on the environment (what neighboring nuclei are present) of the hydrogen(s) in question. The nucleus of the hydrogen atom is shielded by the electron that is present, and the neighboring nuclei can either reinforce this shielding or oppose this shielding (deshielding). If the shielding is reinforced (as in the case of a neighboring hydrocarbon residue), a higher applied magnetic field is needed and the resonance will appear at lower ppm (upfield). If an electronegative element (halogen, oxygen), or an electron withdrawing group (C=O, Ar, C=C) is adjacent, then the shielding is lessened (deshielding occurs) and the resonance will appear at higher ppm (downfield). See the table inside the back cover for positions. How many signals would one expect in ethanol? What would be the shift of each?-
CH3CH2OH has 3 signals: one for H's of CH3 @ between 1 and 1.5 ppm one for H's of CH2 (next to oxygen-deshielded) @ ~3.5 ppm one for H of OH (attached directly to oxygen; slightly different influence) @ 1 - 4 ppm (actually 4 ppm in this case)
Intensity of Signal: Integration of Peak Area
The NMR gives us the ability to calculate the area under the signal. This area is proportional to the number of H's that are responsible for that signal. It will provide a relative ratio of each type of hydrogen that is present in the molecule. Let the smallest integral be 1 and measure all others relative to this. In the event of a 1/2 fraction, multiply all by 2, since ratio should be whole numbers, i.e., a 1:1.5 ratio is 2:3. In the case of the ethanol molecule, integration would show a ratio of 1:2:3.Splitting of the Signal into Several Peaks: Spin-Spin Splitting
This is a powerful tool in deducing the 1HNMR spectra. The neighboring hydrogen nuclei (on an atom adjacent to the one in question) will cause the signal to split. Two things one should consider when examining spin-spin splitting are: Chemically equivalent hydrogen nuclei do not cause splitting to occur, whether they are on the same carbon or a different one..png)
Figure 1: All three H's are equilvalent; therefore, no splitting
.png)
Figure 2: All 6 H's are chemically equilvalent; therefore, no splitting
-
# of neighbors peaks 0 1 (singlet) 1 2 (doublet) 2 3 (triplet) 3 4 (quartet) n n + 1 (multiplet)
Procedure
View the Proton NMR Interpretation video that shows you how to interpret an NMR spectrum step by step.In-Lab Questions
Download and print the following worksheet. You will use this worksheet to record your answers to the In-Lab questions.
Questions
Question 1: Draw the structural formulas of the following compounds and indicate the number of NMR signals that would be expected for each compound.
-
amethyl iodide
-
b2,4-dimethylpentane
-
ccyclopentane
-
dpropylene (propene)
Question 2: Draw the structural formula of the compounds that are indicated by the following data:
-
aan alkyl halide with a molecular formula of C3H7Cl whose NMR spectrum contains two signals: a doublet (6H), and a multiplet (1H).
-
ba compound with molecular formula C7H14Cl2 whose NMR spectra contains three signals: a singlet (9H), a triplet (3H), and a quartet (2H).
Question 3: Figures 3-7 are representative spectra of compounds. Based on the NMR spectra shown, please provide a reasonable structure for each compound.
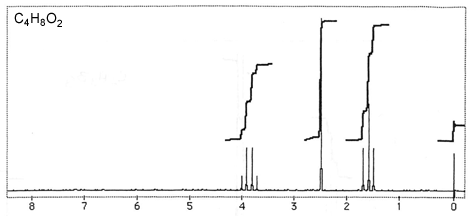
Figure 3
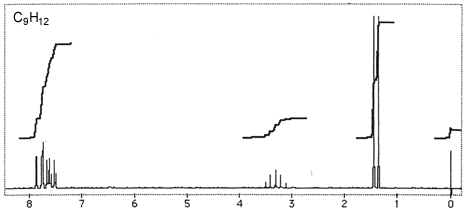
Figure 4
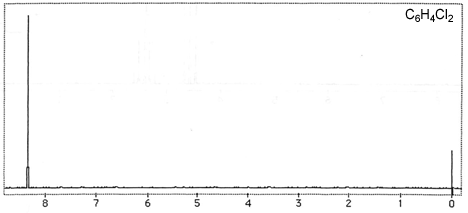
Figure 5

Figure 6
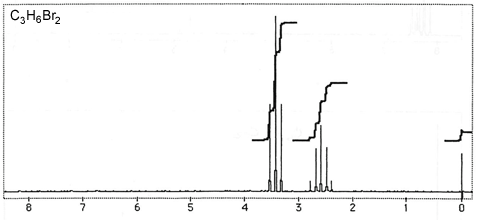
Figure 7