logP and logD Calculation

  1. Introduction
  2. Symbols
  3. Definition of Partition Coefficient P and Distribution Coefficient D
  4. Micro Partition Coefficient
  5. Relation Between Macro and Micro Partition Coefficients
  6. LogP calculation methods
  7. Examples
  8. References

1. Introduction

The mass flux of a molecule at the interface of two immiscible solvents is governed by its lipophilicity. The more lipophilic a molecule is, the more soluble it is in lipophilic organic phase. For the same reason, drug penetration into a biological membrane is also influenced by its lipophilicity. When a molecule is ionizable at the pH of a solution, it forms a hydrophilic anion or cation and subsequently fails to dissolve in organic phase. Ionization of a molecule leads to the accumulation of the hydrophilic form in the aqueous phase. In contrast, its lipophilic form will decrease in both aqueous and organic phase due to the law of conservation of mass. The partition coefficient of a molecule observed in a water–n-octanol system has been adopted as the standard measure of lipophilicity. The observed partition coefficient depends on the support electrolyte concentration of the bulk phase the compound is dissolved in. Extra ion-pair forming chemical agents added to the aqueous/organic phase may have a significant effect on the partitioning behavior of a molecule.
It is often meaningful to obtain the partition coefficients of molecules by calculation. The molecular structure and extent of ionization are the primary factors in calculating the partition coefficient. The standard partition coefficient of ionized and unionized species calculated from the molecular structure is based largely on the atomic logP increments given in Ref.1. The extent of ionization at a given pH is obtained from the predicted pKa of a molecule. Our calculation method takes into account the effect of the counterion ion concentration on logD and logP.

2. Symbols

Throughout this document we use the following symbols:

3. Definition of Partition Coefficient P and Distribution Coefficient D

The partition coefficient is the ratio of the concentration of the compound in octanol to the concentration of the compound in water. The distribution coefficient is the ratio of the sum of the concentrations of all species of the compound in octanol to the sum of the concentrations of all species of the compound in water. Based on acid dissociation reactions, we can introduce the concept of a partition coefficient for cationic and anionic species and for neutral species. The following gives the definition of partition and distribution coefficients for ionized and unionized species.
logPlogD_def
The partition and distribution coefficients for multiprotic compounds are defined in much the same way as for monoprotic compounds, using the following formulas.
multipro_def

Example

In this example we suppose that the compound A1A2B1B2 contains two acidic and two basic ionization sites. This compound has 16 protonation states in aqueous solution. The microspecies which are assigned to the protonation states are summarized in Table 1.

Table 1.
Microspecies
charge
A1A2B1B2
0
A1-A2B1B2
-1
A1A2-B1B2
-1
A1A2B1+B2
+1
A1A2B1B2+
+1
A1-A2-B1B2
-2
A1-A2B1+B2
0
A1-A2B1B2+
0
A1A2-B1+B2
0
A1A2-B1B2+
0
A1A2B1+B2+
+2
A1-A2-B1+B2
-1
A1-A2-B1B2+
-1
A1-A2B1+B2+
+1
A1A2-B1+B2+
+1
A1-A2-B1+B2+
0

Partition coefficients and distribution coefficients are expressed by the following formulas:
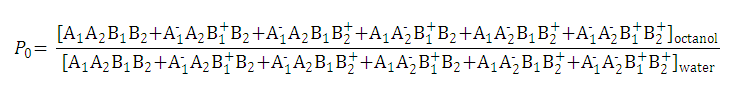
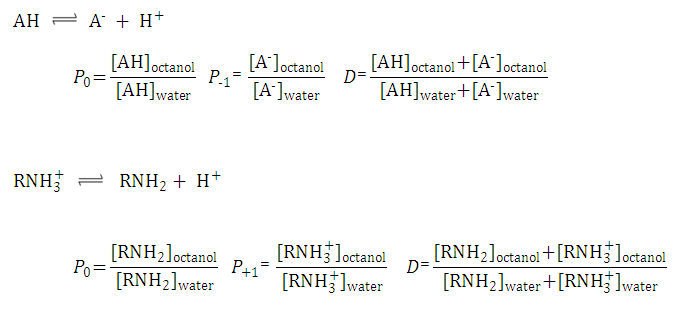
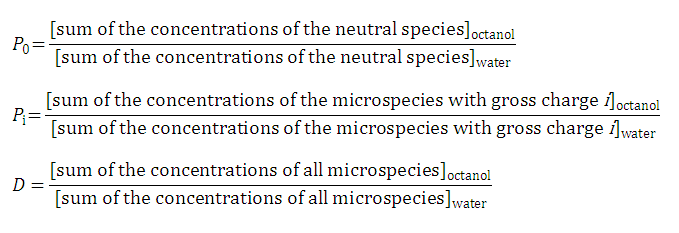
1. Partition coefficient of the neutral species: P0_exp
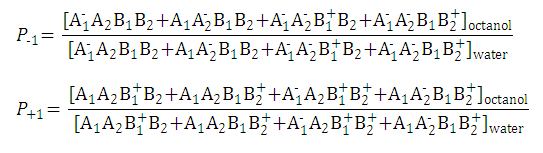
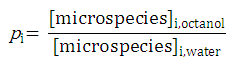
2. Partition coefficient of the anionic and the cationic species: P_ion1_exp P_ion2_exp
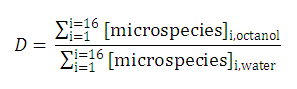
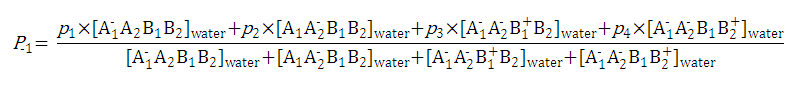
3. The distribution coefficient of the A1A2B1B2 molecule: D_exp

4. Micro Partition Coefficient

The micro partition coefficient is the ratio of the concentration of two microspecies defined with pi as expressed with the next relation:
pi_exp

5. Relation Between Macro and Micro Partition Coefficients

Macro partition coefficients P0…Pi can also be expressed as a function of micro partition coefficients p0…pi.
From the definition of micro partition coefficients, we obtain the following formula for the concentration of microspecies in octanol:

[microspecies]i,octanol = pi ⋅[microspecies]i,water
where pi is the micro partition coefficient of microspecies i.

For example, P-1 includes four micro partition coefficients (p1, p2, p3, p4). They are given by:

p1p2p3p4

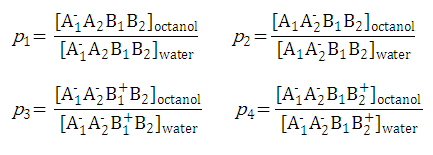
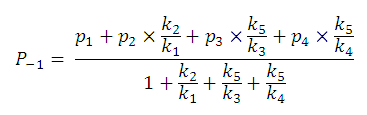
After substituting the pis into the original formula for P-1 we get the following simpler formula which includes only aqueous concentration of the appropriate microspecies:

P_1_new

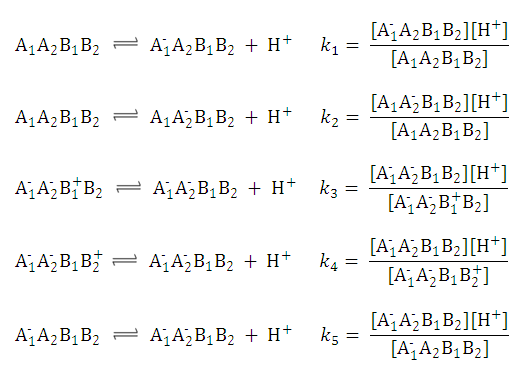
This can be further simplified if we introduce the acid dissociation constants of the A1A2B1B2 molecule. The next five ionization reactions of the A1A2B1B2 molecule are used to rearrange P-1 into a concentration free form.

5_reaction

So we can further simplify the formula for P-1 to the following. This expression reveals that P-1 does not depend on the pH of the solution:
P_1_Concfree

Similarly, one could show that P0, P+1, P-2 and P+2 are also pH-independent.

In contrast to this, the distribution coefficient D does depend on the solution pH (see Ref.2.):
D_pi

6. logP calculation methods

logP calculations are based on a pool of fragments predefined in the calculator. This set is based on the data set in references 1. Every fragment is assigned a unique name and a value.

The logP value of a molecule is the sum of the fragment values present in the molecule.
logP plugin handled only one fragment set until version 5.1.2, above, it was extended with two additional sets. The sets are based on a published data set (see reference 2) and the PhysProp© database.
The trainable logP (available from version 5.1.3) offers the user to define his own logP database and calculate logP values based on the experimental data. New fragment value extensions make a more precise calculation possible.
Choosing the weighted method requires the user to define the weight of each set of data needed. This method may include any of the three internal data sets and the user defined set.


7. Examples

Example 1

The compound below is zwitterionic that looks like the A1A2B1B2 molecule in the theoretical section above. Lipophilicity of this compound reaches its maximum near to the isoelectric point.

Example 2

Homidium is a quaternary ammonium ion with strong hydrophilic character. Its logP is calculated with the use of the ionic fragment of the N+ ion. The calculated and measured logP agree.
Calculated logP = -1.09 measured logP= -1.10 , see Ref.3.

Example 3

Ibuprofen has the typical logD vs. pH profile that is characteristic of acidic compounds. Lipophilic behavior of ibuprofen will be dominant when its carboxylic group is unionized (at low pH). At higher pH the carboxylic group reaches the fully ionized state and hydrofilicity becomes enhanced.

Example 4

The measured distribution coefficient also depends on the method. The shake flask and the pH-metric methods are the most popular. The figure below shows the calculated and measured logD of lignocaine as function of pH.


7. References

  1. Viswanadhan, V. N.; Ghose, A. K.; Revankar, G. R. and Robins, R. K., J.Chem.Inf.Comput.Sci., 1989, 29, 3, 163-172; doi
  2. Klopman, G.; Li, Ju-Yun.; Wang, S.; Dimayuga, M.: J.Chem.Inf.Comput.Sci., 1994, 34, 752; doi
  3. PhysProp© database, webpage
  4. Csizmadia, F.; Tsantili-Kakoulidou, A.; Panderi, I. and Darvas, F., J.Pharm.Sci., 1997, 86, 7, 865-871; doi
  5. Bouchard, G.; Carrupt, P. A.; Testa, B.; Gobry, V. and Girault, H. H., Pharm.Res., 2001, 18, 5, 702-708; doi