
Air Resistance
Introduction
When you solve physics problems involving free fall, often you are told to ignore air resistance and to assume the acceleration is constant and unending. In the real world, because of air resistance, objects do not fall indefinitely with constant acceleration. One way to see this is by comparing the fall of a baseball and a sheet of paper when dropped from the same height. The baseball is still accelerating when it hits the floor. Air has a much greater effect on the motion of the paper than it does on the motion of the baseball. The paper does not accelerate very long before air resistance reduces the acceleration so that it moves at an almost constant velocity. When an object is falling with a constant velocity, we use the term terminal velocity, or vT, to describe its velocity. On a short drop to the floor, the paper reaches terminal velocity very quickly, but the baseball will not reach terminal velocity. Air resistance is sometimes referred to as a drag force. Experiments have been done with a variety of objects falling in air. These sometimes show that the drag force is proportional to the velocity and sometimes that the drag force is proportional to the square of the velocity. In either case, the direction of the drag force is opposite to the direction of motion. Mathematically, the drag force can be described usingFDrag = −bv
or FDrag = −cv2.
The constants b and c are called the drag coefficients that depend on the size and shape of the object.
When falling, there are two forces acting on an object: the weight, mg, and air resistance, –bv or –cv2. At terminal velocity, the downward force is equal in magnitude to the upward force, so mg = −bv
or mg = −cv2,
depending on whether the drag force follows the first or second relationship. In either case, since g and b or c are constants, the terminal velocity is affected by the mass of the object. Taking out the constants, this yields either
If we plot mass versus vT or vT2, we can determine which relationship is more appropriate.
In this experiment, you will measure terminal velocity as a function of mass for falling coffee filters and use the data to choose between the two models for the drag force. Coffee filters were chosen because they are light enough to reach terminal velocity in a short distance.
Objectives
The objective of this lab is to observe the effect of air resistance on falling coffee filters and to measure their terminal velocity in free fall. From these measurements you will attempt to determine the relationship between the terminal velocity and the mass of the coffee filters, in order to choose between two competing force models for the air resistance on falling coffee filters.Apparatus
- Computer
- LabPro interface box
- Vernier Motion Detector
- Logger Pro software
- 5 basket-style coffee filters
- String
- Timer
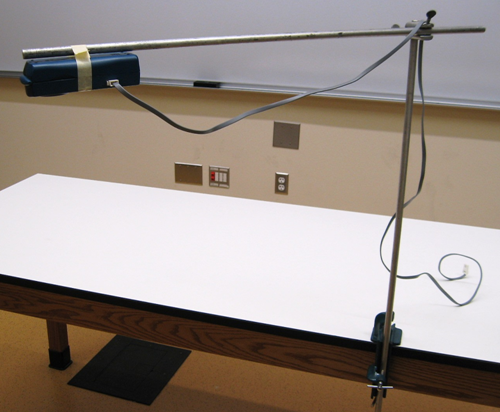
Figure 1
Preliminary Questions
1
Hold a single coffee filter in your hand. Release it and watch it fall to the ground. Next, nest two filters and release them. Did two filters fall faster, slower, or at the same rate as one filter? Use the timer to make a coarse measurement of their rate of fall. What kind of mathematical relationship do you predict will exist between the velocity of fall and the number of filters?
2
If there was no air resistance, how would the rate of fall of a coffee filter compare to the rate of fall of a baseball, for example?
3
Sketch a graph of the velocity vs. time for one falling coffee filter.
4
When the filter reaches terminal velocity, what is the net force acting upon it?
Procedure
Please print the worksheet for this lab. You will need this sheet to record your data.
Measuring Air Resistance
1
Verify that the motion detector is connected to DIG/SONIC 2 of the LabPro interface unit.
2
Prepare the computer for data collection by opening the "air resistance" file from the Physics with Vernier experiment files of Logger Pro. A graph will appear on the screen. The vertical axis has distance scaled from 0 to 3 m. The horizontal axis has time scaled from 0 to 4 s. Change the sampling rate to 50 samples/sec.
3
Partner A holds a coffee filter with both hands and positions it about 0.1 m under the motion detector, which is located on a support. Do not hold the filter closer than 0.1 m to the detector.
4
Partner B clicks "Collect" to begin data collection. When the motion detector begins to click, Partner A releases the coffee filter directly below the motion detector so that it falls toward the floor. Partner A moves his/her hands out of the beam of the motion detector as quickly as possible so that only the motion of the filter is recorded on the graph. You may wish to practice this a time or two before you record your final data. If the motion of the filter was too erratic to get a smooth graph, repeat the measurement. With practice, the filter will fall almost straight down with little sideways motion.
5
The velocity of the coffee filter can be determined from the slope of the position vs. time graph. At the start of the graph, there should be a region of increasing slope (increasing velocity), and then it should become linear. Since the slope of this curve is the velocity, the linear portion indicates that the filter was falling with a constant or terminal velocity, vT, during that time. Once you have recorded a reasonable data run, export this data in CSV format to your desktop.
6
Open your data file using Excel and make a plot of the position versus time for the coffee filter. Find the portion of the graph that looks to be linear and using the trendline feature in Excel find the slope of this linear portion of the position versus time graph.
7
Record the slope (terminal velocity) in Table 1.
8
Repeat steps 3–7 for two, three, four, and five coffee filters. Note: You may have to use some of the string to tie the filters together so that they fall as a single unit. Record the results of these measurements in Table 1.
9
Draw a free body diagram of a falling coffee filter. There are only two forces acting on the filter. Note that once the terminal velocity, vT, has been reached, the acceleration is zero, so the net force, F = ma,
must also be zero.
Analysis
1
To help choose between the two models for the drag force, plot terminal velocity vT vs. number of filters (mass). Using the data from Table 1, graph vT2 vs. number of filters (mass) in Excel. When plotting these graphs, you should label the horizontal axis (# of coffee filters) and the vertical axis (terminal velocity vT or vT2). Be sure to give the graphs a title name.
2
During terminal velocity, the drag force is equal to the weight, mg, of the filter. If the drag force is proportional to velocity, then vT ∝ m. Or, if the drag force is proportional to the square of velocity, then vT2 ∝ m. From your graphs, which proportionality is consistent with your data; that is, which graph is closer to a straight line that goes through the origin?
3
From the choice of proportionalities in the previous step, which of the drag force relationships (–bv or –cv2) appears to model the real data better? Notice that you are choosing between two different descriptions of air resistance—one or both may not correspond to what you observed.
4
How does the time of fall relate to the weight, mg, of the coffee filters (drag force)? If one filter falls in time, t, how long would it take four filters to fall, assuming the filters are always moving at terminal velocity?