
Appendix J: Using the Linest Function in Excel
The linest function in Excel is used to find the uncertainties in the slope and y-intercept of a straight line that best fits your data. To use the linest function, follow the steps below.-
1After you enter the necessary data, highlight a two by two box of cells (see Fig.1 below).
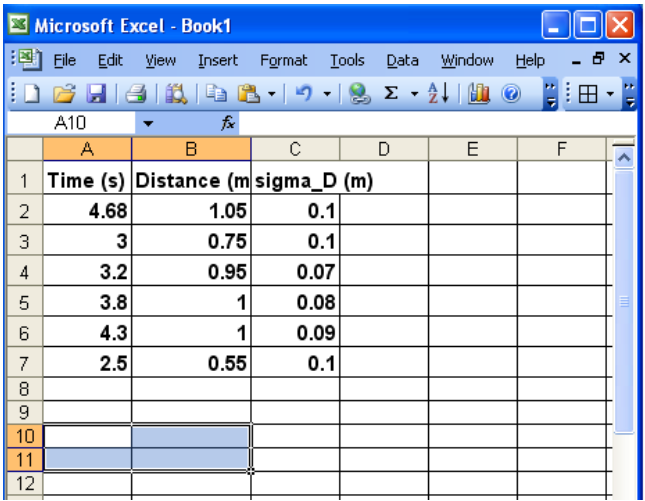
Figure 1: Highlighting a 2 by 2 box of cells
-
2Type =linest(. A help box is displayed as shown in Fig.2 below.
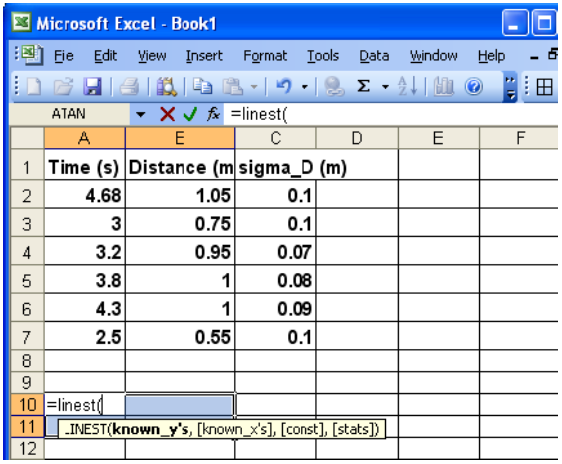
Figure 2: Linest function
-
3Input the necessary arguments into this two by two box in the following order (see Fig. 3).
-
aHighlight the y values.
-
bType ,.
-
cHighlight the x values.
-
dType 1,1).
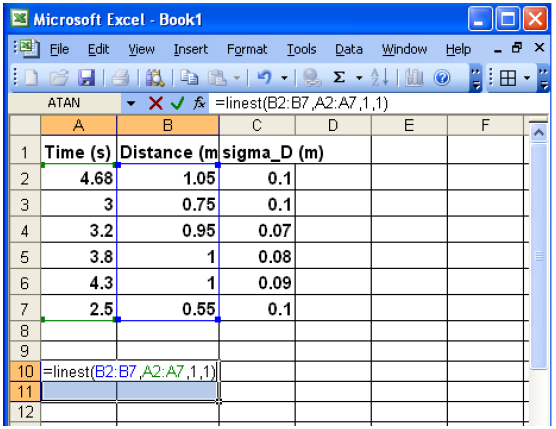
Figure 3: Input for the linest function
-
-
4Press CTRL+SHIFT+ENTER. The four numbers are displayed as shown in Fig. 4.Notice that cells A10 and A11 display the slope and its uncertainty, while cells B10 and B11 display the intercept and its uncertainty. Although Excel gives the uncertainties in the slope and intercept to several digits, recall that uncertainties should always be reported to one significant digit.
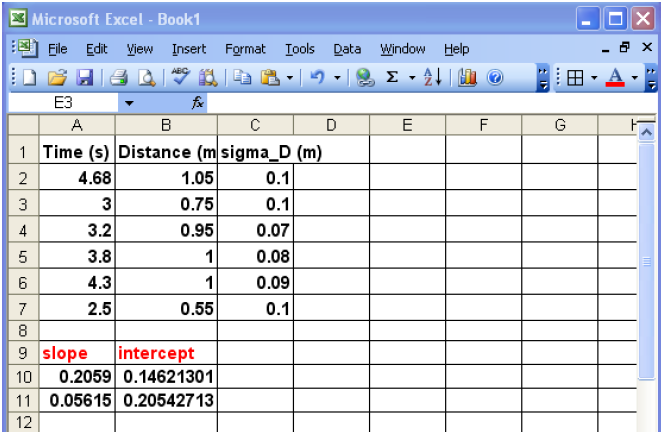
Figure 4: Four numbers generated by the linest function
-
The slope and intercept given by the Linest function is the same as that found from the equation to
the trendline (see Fig. 5 below). However, the latter does not display the uncertainties associated
with the slope and intercept.
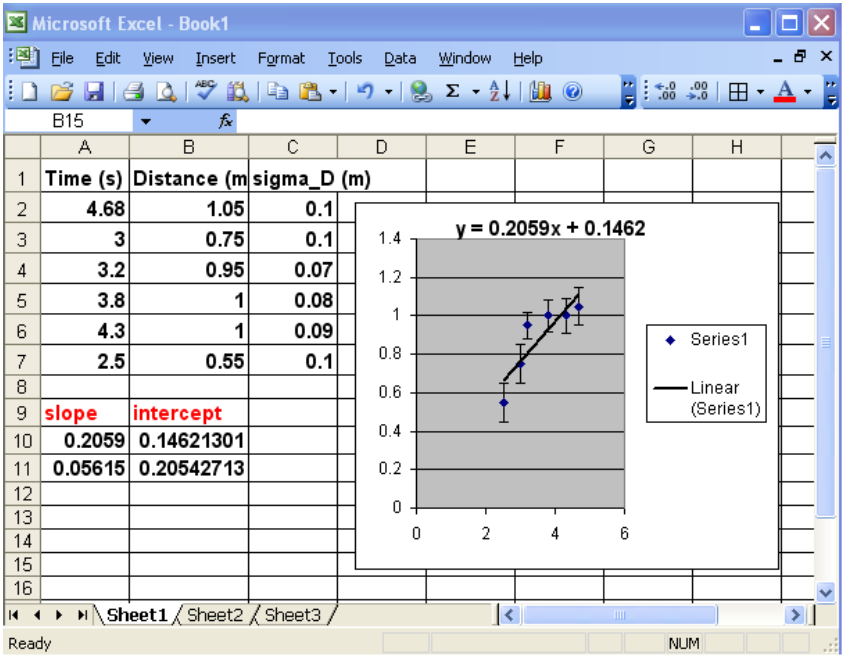
Figure 5: Comparing outputs from linest and trendline equation