
Appendix E: Using Excel to Calculate the Average and Standard Deviation
Excel can be used to calculate the average value of a set of measurements and the standard deviation. To use Excel for this purpose, follow these steps.-
1Enter the readings in the first column. In this example, the values entered in cells A3 to A7 are the height (in inches) of five students (see Fig. 1 below).
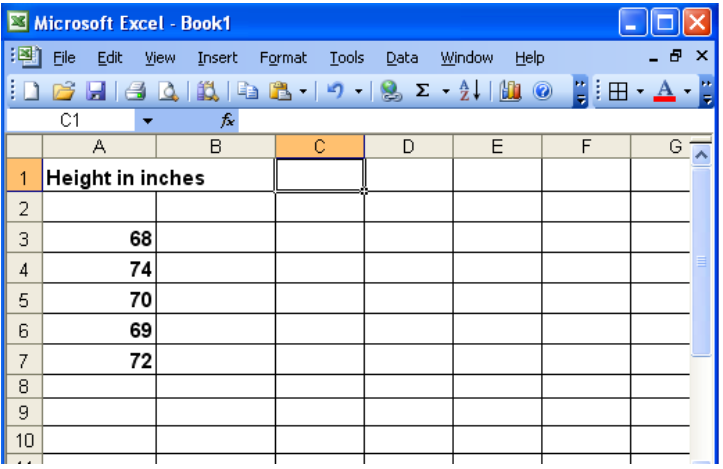
Figure 1: Entering your data
-
2In cell A8 type = and select AVERAGE from the pull-down menu, (see Fig. 2 below).
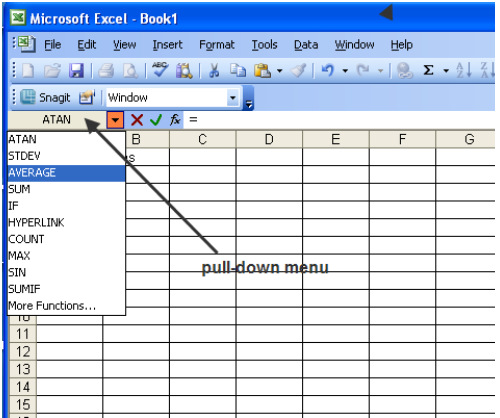
Figure 2: Selecting from the pull-down menu
-
3The Functions Argument window with A3:A7 in the Number 1 field is displayed as shown in Fig. 3 below.
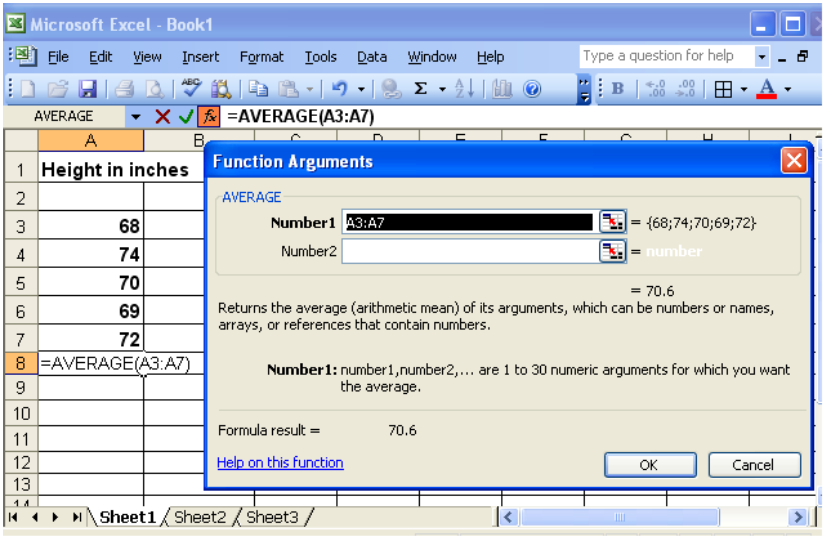
Figure 3: Finding the average value
-
4Select OK. The average of the five values is displayed.Alternately, you can combined steps 2, 3, and 4 by typing = AVERAGE(A3:A7) and pressing ENTER.
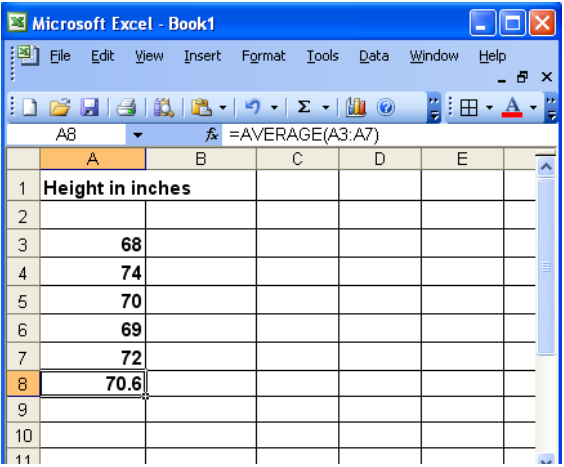
Figure 4: Average value is displayed
-
5In cell A9, type = and select STDEV from the pull-down menu. The Function Argument window is displayed.
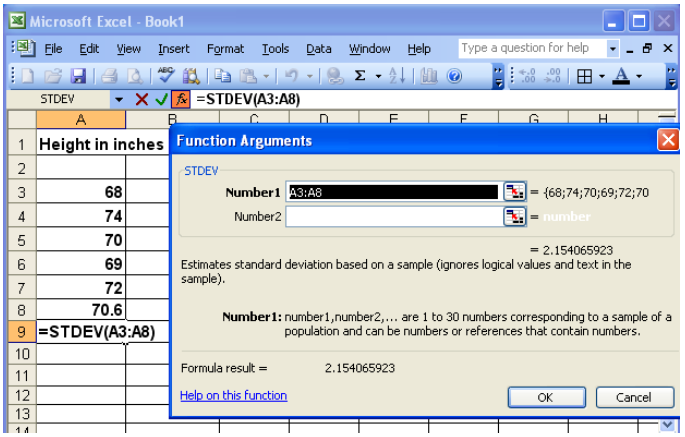
Figure 5: Finding the standard deviation
-
6Excel automatically calculates the standard deviation of the five heights and the average. To input the correct range, click the icon to the right of the Number 1 field and select cells A3 through A7.
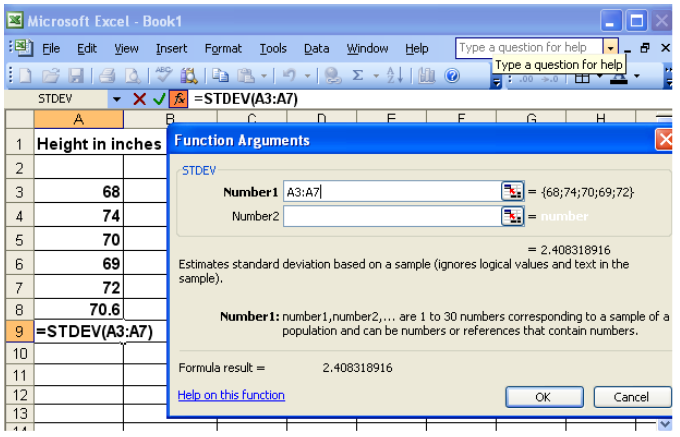
Figure 6: Selecting the required cells for finding the standard deviation
-
7Click OK. The standard deviation is displayed.
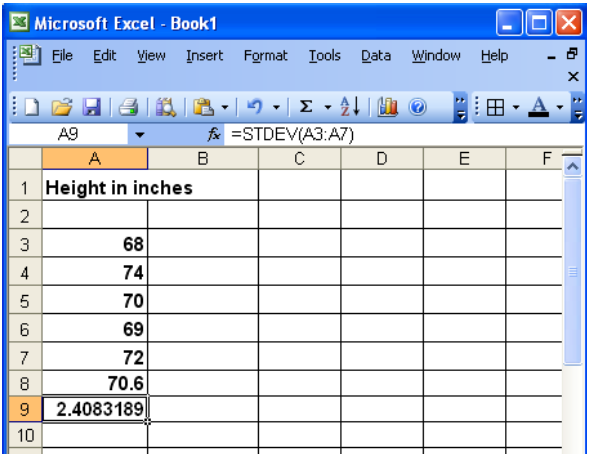
Figure 7: Standard deviation is displayed