
Lab Investigation 4 - How could you make more of this dye?
Using spectroscopy to determine solution concentration
Guiding Question
How could you make more of this dye?Introduction
A solution is a homogeneous mixture of two or more substances. Simple solutions consist of one solvent and one or more solutes. The solvent is the major liquid component of the mixture in solutions that contain one or more liquids. The most common solutions are aqueous solutions, in which water is the solvent. The concentration of a solute is the ratio of the amount of solute to the amount of solution or solvent. One of the most common ways to report concentration is in units of molarity. Molarity is defined as the number of moles of solute in one liter of solution. It has units of moles/liter (mol/L) and is given the symbol M. For example, if 1.5 moles of sodium chloride is dissolved in enough water to make 1.0 liter of solution, the concentration of sodium chloride is 1.5 M, or 1.5 mol NaCl/L of solution. This would be spoken as "1.5 molar." In order to accurately make solutions of known molarities, we must accurately determine the number of moles of the solute and the volume of the solution. Spectroscopy uses the interaction of chemical molecules with light to characterize a substance. This characterization depends to some extent on part of electromagnetic spectrum utilized. For example, food dyes absorb visible light at characteristic wavelengths known as their analytical wavelengths. The magnitude of the absorption is directly related to the solution concentration. You will use the absorption of visible light to determine concentration and to identify different dyes. If the concentration of a solution is unknown, the concentration can be measured by determining the amount of light it absorbs (its absorbance, A) at a particular wavelength (λ), using a spectrophotometer. Absorbance and concentration, c, are directly related by Beer's Law.( 1 )
A = ε l c
( 2 )
CiVi = CfVf
The Problem
Your research team has been asked to prepare more of certain color dye solution. Unfortunately you were not told the composition or the concentrations of the components in the dye solution.Materials available for use
- UV-Vis Spectrophotometer
- Spectronic 20D spectrophotometers
- 10 mL Graduated Cylinders
- 50 mL Beakers
Safety Precautions
Caution:
Wear goggles at all times.
Wear goggles at all times.
Spec-20
Getting Started
1
In the pre-laboratory exercise of this investigation you will prepare a Beer's Law calibration curve for a primary dye.
2
To answer the guiding question, you will use the UV/VIS spectrometer to identify the components of the mixture and the calibration curves generated by the class to determine the concentration of each component.
Procedure
1
Obtain a practice solution of the same dye that you used to prepare the calibration curve and determine the practice solution's concentration. Verify your result with the instructor.
2
Obtain your unknown dye solution (orange, green or purple).
3
Determine the analytical wavelength(s) for your dye using the UV/Vis spectrometer.
- How does this help you identify the components of your dye solution?
4
Find the absorbance value(s) and use the appropriate calibration curve(s) to determine concentration.
5
Use the molecular weights for the FD&C dyes to provide a final answer to the guiding question.
-
Blue 1 (B1, Brilliant Blue) C37H34N2O9S3Na2 792.84 g/mol Yellow 5 (Y5, Tartrazine) C16H9N4O9S2Na3 534.37 g/mol Red 3 (R3, Erythrosine) C20H6I4O5Na2 897.88 g/mol
Interactive Poster Session
Once your group has completed your work, prepare a whiteboard that you can use to share and justify your ideas. See the handout provided for details on this process.Report
Once you have completed your research, you will need to prepare an investigation report that consists of three sections. Your report should answer these questions in 2 pages or less. This report must be typed and any diagrams, figures, or tables should be embedded into the document. Generally, you need one page for the first two sections and the second page for third section.- Section 1: What concept were you investigating, and how does it relate to the guiding question? How could you make more of this dye? See the introduction on molarity and Beer's Law to get started. Relate this concept to the guiding question. You should describe and discuss solutions, molarity, and the relationship between absorptivity and concentration.
- Section 2: How did you go about your work and why did you conduct your investigation in this way? How did you find the concentration values and identify the dye(s)?
- Section 3: What is your argument? Remember the question is: HOW can you make more of this dye? You need to justify the components as well as the concentrations.
-
This third section is where you not only present your data, but also use the values you obtain as evidence in your reasoning. Statements like, "see data table for values" are not acceptable!
Spectroscopy Background
Begin by viewing the online video "Spectronic 20." In this video background information on the theory and use of a spectrophotometer is provided including how to calibrate a spectrophotometer, generate a Beer's Law plot and use it to determine the concentration of an unknown. There are two principal ways in which the spectrophotometer displays data. The %T is a linear scale in which 100%T means that the sample is absorbing none of the light passing through it to 0%T in which all of the light is being absorbed (0% is making it through the sample). The Spectronic 20D most accurately measures light in the percent transmission mode. While %T is easily measured, the absorbance is a more useful value. The conversion between %T and absorbance is a simple one.( 3 )
A = 2.000 − log(%T sample)
( 4 )
A = ε l c
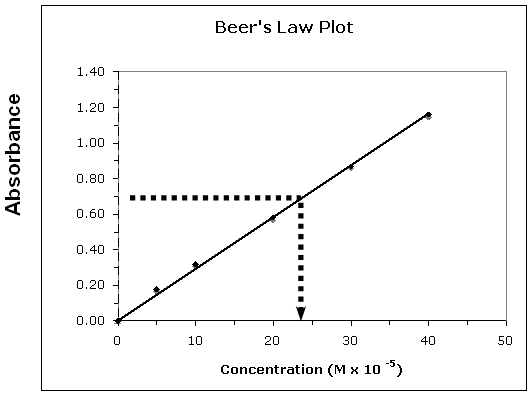
Figure 1: Beer's Law Plot
-
•In this case m = 0.030 and b = 0.
-
•Using these values the equation becomes: y = 0.03x + 0.
-
•Substituting the absorbance value: 0.65 = 0.030x; x = 21.6 × 10⁻⁵ M or 2.2 × 10⁻⁴ M.
Preparing a Beer's Law Plot
Please print the worksheet for this lab. You will need this sheet to record your data.
1
Obtain two cuvettes for the Spectronic 20D. Fill one cuvette (sample) about 3/4 full with a diluted dye solution, and the second cuvette with distilled/deionized water (reference/blank). This reference/blank is usually the solvent by itself or a solution of all the components other than the specific solute under study and will be used to set the spectrophotometer to 100% Transmittance.
2
Set the Spectronic 20D to the appropriate analytical wavelength for the dye to be measured. Set the output to % Transmittance.
3
With no cuvette in the sample holder and the sample lid closed, use the front left knob to set the readout to 0%T.
4
Insert the blank into the sample well making sure the marking on the cuvette is lined up with the notch on the sample well. Use the front right knob to adjust the readout to 100%T. Make sure to only handle the cuvette at the rim (mouth) and not in the path of the light. Finger grease and other materials will absorb light and throw off your results. Clean the outside of the cuvettes with KimWipe tissue.
5
Remove the blank and insert the sample cuvette with solution D, record the %T. Remove the sample cuvette and discard the dye into a waste beaker.
NOTE: The spectrophotometer must be calibrated to 100% and 0% before every measurement because the spectrophotometer's accuracy varies with time, current fluctuations and temperature changes. This is why you need to keep your reference cuvette in a safe place to re-calibrate the machine often. Repeat measurement procedure for each solution.
6
Convert %T to Absorbance using Equation 3A = 2.000 − log(%T sample)
7
Perform least-square analysis (linear regression) to obtain calibration curve. The closer the correlation coefficient (R2) is to 1, the more linear the data. Look at your graph. If there is an obvious outlier, you may want to repeat that measurement.
Practice: Determining unknown concentration of dye
1
Obtain a practice solution of the same FD&C dye that was used to prepare the calibration curve.
2
Follow same calibration procedure to set 0%T and 100%T; then measure %T of unknown concentration.
3
Convert %T of unknown to Absorbance; then use the calibration curve to determine the practice solution's concentration. Verify your result with the instructor.