Plot figures on the Cartesian coordinate plane. Your graph is scored automatically
by WebAssign when you submit the assignment for grading. 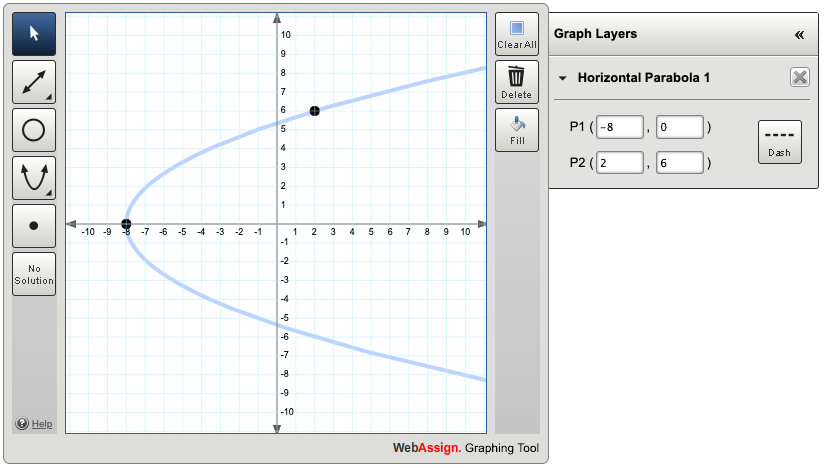
The WebAssign graphing tool supports points, rays, segments, lines, circles, and parabolas. Inequalities can also be indicated by filling one or more areas.
When you work on a graphing question, the WebAssign graphing tool displays below the question.
The middle of the graphing tool is the drawing area. It contains labeled coordinate axes, which may have different axis scales and extents depending on the nature of the question you are working on.
The left side of the graphing tool contains tools for drawing and selecting objects, as well as the No Solution button. If there is no possible solution to a graphing question, click No Solution.
The right side of the graphing tool contains tools for deleting objects and filling regions of the graph.
Click ![]() to open the Graph Layers tool. You can view and edit the
properties of graphed objects in Graph Layers.
to open the Graph Layers tool. You can view and edit the
properties of graphed objects in Graph Layers.
Depending on the question, the graphing tool might display both x and y axes, or only the x axis. If only the x axis is displayed, you can specify only x coordinates; the y coordinate will always be 0. The maximum and minimum allowed values on the graph in the graphing tool are also dependent on the question.
-
Graph an object.
To do this Do this Graph a point - Click
 .
. - Click a location in the graph.
Graph a line, ray, or line segment - Click
 to expand the line tools, and click the
object you want to graph.
to expand the line tools, and click the
object you want to graph. - Click the location of the first point.
- Click the location of a second point.
Graph a circle - Click
 .
. - Click the location of the center of the circle.
- Click the location of a point on the circle.
Graph a parabola - Click
 to expand the parabola tools, and click
the object you want to graph.
to expand the parabola tools, and click
the object you want to graph. - Click the location of the vertex of the parabola.
- Click the location of another point on the parabola.
- Click
-
Edit the graph.
To do this Do this Move an object If the object has multiple points, graph the entire object before attempting to move it.
- Click
 .
. - Click and drag an object to a new location.
You can also move an object by editing its points in Graph Layers.
Note Parabolas must be moved by editing points in Graph Layers.
Reshape an object - Click .
- Click an object to select it.
- Click and drag a point on an object to a new location.
You can also reshape an object by editing its points in Graph Layers.
Set an open/closed endpoint for a ray or line segment Click an endpoint on the graph to toggle between open and closed. Set a dashed line style to specify inequality - Click .
- Click an object.
- In Graph Layers, click Dash.
Delete an object - Click .
- Click an object.
- Click Delete.
Delete all objects - Click Clear All.
A message displays to confirm that you want to delete all objects.
- Confirm that you want to clear the graph.
Fill a region of the graph Note Clicking any button in the graphing tool after you add fills will remove them, so be sure to fill regions last.- Graph objects to create boundaries for the inequality.
- Click Fill.
- Click the middle of the region you want to fill.
Do not click near a boundary line.
- Click