Make a Histogram with WAPlot

Make a histogram using Mathematica® syntax.
Histogram showing frequency of AP test scores among 12 students, with 1 score of 1, 3 scores of 2, 2 scores of 3, 4 scores of 4, and 2 scores of 5.

  1. Click Questions > Create.
    The Question Editor opens.
  2. In Name, type a name for the question.
  3. In Mode, select one of the question modes to define the basic behaviors for your question.
  4. In Question, type your question.

    Use the answer placeholder string <_> to specify where the answer box should be displayed.

  5. In Answer, specify the answer key for your question. Often, you will specify distractors or options configuring your question's behavior.
  6. Add WAPlot tags to the question, answer, or solution field of a question.
    If a WAPlot image is used in the answer field, the question mode must be multiple-choice, and there cannot be linebreaks in the WAPlot code. WAPlot images cannot be placed in assignment descriptions.
    <waplot type='MathematicaSyntax'> </waplot>
  7. Insert the Mathematica code for your function inside the WAPlot tags.
    
    <waplot type='MathematicaSyntax'>
        Histogram[
            {1, 2, 2, 2, 3, 3, 4, 4, 4, 4, 5, 5},  
            {1, 6, 1},
            Frame->{{True, False}, {True, False}}, 
            FrameTicks->{{{0, 1, 2, 3, 4, 5}, None}, {{{0.5, "0"}, {1.5, "1"}, {2.5, "2"}, {3.5, "3"}, {4.5, "4"}, {5.5, "5"}}, None}},
            FrameLabel -> {Style["AP Test Scores",16], Style["Frequency",16]},
            PlotRange -> {{1, 6}, {0, 4}}
        ]
    </waplot>

    In this example, {1, 6, 1},represents the starting and ending points of the x values and how wide the bars should be.

    To show that the scores marked on the x-axis are whole numbers and not ranges, we place our tickmarks in the center of the bar.

  8. In the <waplot> tag, use the @alt attribute to add alternative text describing the image for students using screen readers.
    
    <waplot type='MathematicaSyntax' alt='Histogram showing frequency of AP test scores among 12 students, with 1 score of 1, 3  scores of 2, 2 scores of 3, 4 scores of 4, and 2 scores of 5.'>
    Make sure the content of the alternative text is appropriate to the pedagogy of your question.

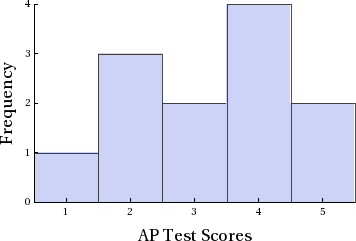
Graphing a Histogram

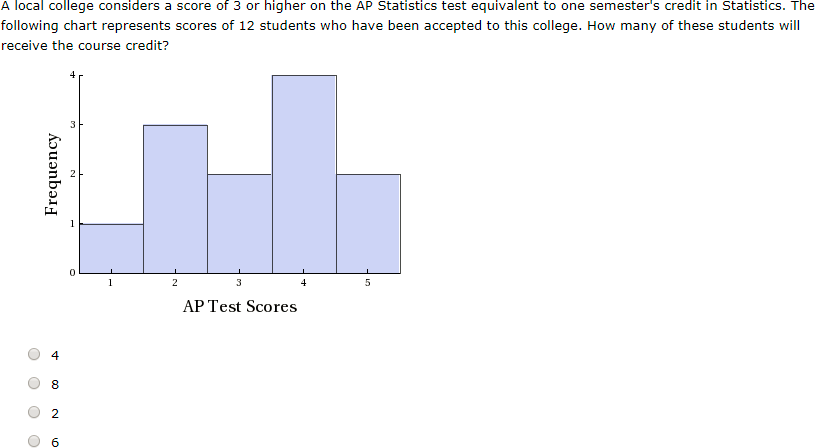
The following table summarizes an actual question.

QID

3980732

Name

Template2 6.WAPLOT.08.

Mode

Multiple-Choice

Question

A local college considers a score of 3 or higher on the AP Statistics test equivalent to one semester's credit in Statistics. The following chart represents scores of 12 students who have been accepted to this college.  How many of these students will receive the course credit?
<figure>
    <waplot type='MathematicaSyntax' alt='Histogram showing frequency of AP test scores among 12 students, with 1 score of 1, 3  scores of 2, 2 scores of 3, 4 scores of 4, and 2 scores of 5.'>
        Histogram[
            {1, 2, 2, 2, 3, 3, 4, 4, 4, 4, 5, 5},  
            {1, 6, 1},
            Frame->{{True, False}, {True, False}}, 
            FrameTicks->{{{0, 1, 2, 3, 4, 5}, None}, 
            {{{0.5, "0"}, {1.5, "1"}, {2.5, "2"}, {3.5, "3"}, {4.5, "4"}, {5.5, "5"}}, None}},
            FrameLabel -> {Style["AP Test Scores",16], Style["Frequency",16]},
            PlotRange -> {{1, 6}, {0, 4}}
        ]
    </waplot>
</figure>
<_>

Answer

8
2
4
6

Display to Students

Question as displayed to students