JMP Output
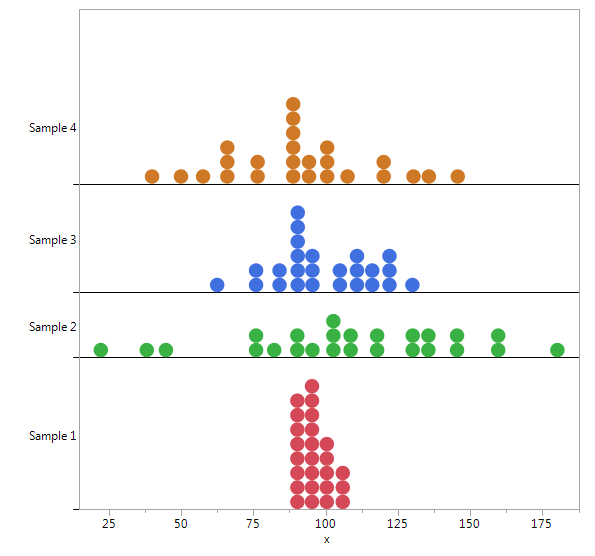
A comparative dotplot is divided into four sections by horizontal lines. From bottom to top, the sections are labeled "Sample 1", "Sample 2", "Sample 3" and "Sample 4." The horizontal axis is labeled "x" and has tick marks from 25 to 175. Each of the four dotplots has 25 points above the axis.
- In Sample 1, four stacks of dots are concentrated between approximately 90 to 105 on the horizontal axis. The highest stack has 9 dots and is at about 95 on the horizontal axis. Moving to the left or right along the horizontal axis away from the highest stack, the stacks tend to decrease in height.
- In Sample 2, fifteen stacks of dots are spread out between approximately 20 to 185 on the horizontal axis. The highest stack has 3 dots and is at about 105 on the horizontal axis. Moving to the left or right along the horizontal axis away from the highest stack, the stacks tend to decrease in height.
- In Sample 3, ten stacks of dots are concentrated between approximately 65 to 130 on the horizontal axis. The highest stack has 6 dots and is at about 90 on the horizontal axis. Moving to the left or right along the horizontal axis away from the highest stack, the stacks tend to decrease in height.
- In Sample 4, thirteen stacks of dots are spread out between approximately 40 to 145 on the horizontal axis. The highest stack has 6 dots and is at about 90 on the horizontal axis. Moving to the left or right along the horizontal axis away from the highest stack, the stacks tend to decrease in height.