The Standard Deviation
A large amount of variability in a sample is indicated by a relatively large variance or standard deviation whereas a variance or standard deviation close to zero indicates a smaller amount of variability. People find the standard deviation to be a more natural measure of variability than the variance because the standard deviation is expressed in the same units as the original data values. The standard deviation can be informally interpreted as the size of a "typical" deviation from the mean.
The "2-standard deviations rule" shown below identifies an acceptable range of values within two standard deviations of the mean
SALT Computations
Click "Use SALT" to access SALT. The exercise data will be automatically imported into the tool. To find the mean and standard deviation, navigate to the Descriptive Statistics tab.
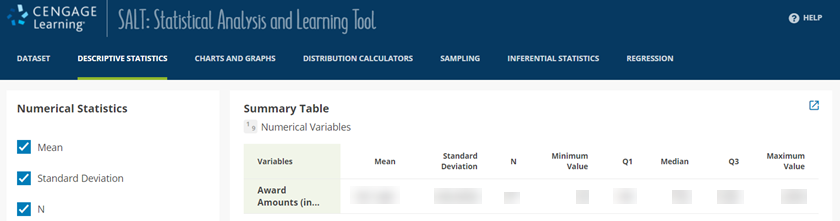
A screenshot of the SALT program is shown. On the menu bar at the top of the page, the tab labeled "Descriptive Statistics" is selected. A partial view of the Descriptive Statistics page is visible below, where a table titled "Summary Table - Numerical Variables" is shown. The table has one row labeled "Award Amounts (in thousands of dollars)" and columns labeled "Mean," "Standard Deviation," "N," "Minimum Value," "Q1," "Median," "Q3," and "Maximum Value."