Predicted Values
The predicted value corresponding to the ith observation in a data set is obtained by substituting that x-value, into the regression equation to obtain where
The slope of the regression line is and the y-intercept is
SALT Computations
Click "Use SALT" to access SALT. The exercise data will be automatically imported into the tool. Navigate to the Regression tab.
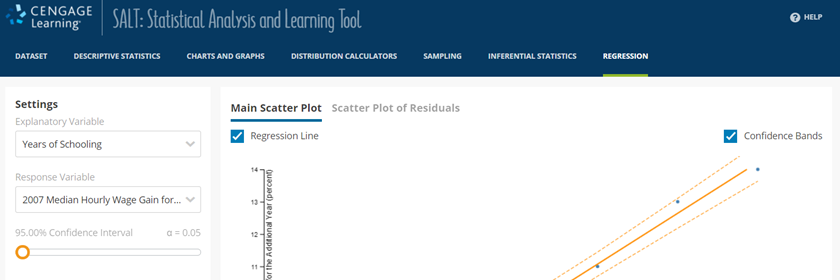
A screenshot of the SALT program is shown. On the menu bar at the top of the page, the tab labeled "Regression" is selected. A partial view of the Regression page is visible below, where a menu labeled "Settings" is shown on the left. In this menu, two drop-down lists labeled "Explanatory Variable" and "Response Variable" have the options "Years of Schooling" and "2007 Median Hourly Wage Gain for the Additional Year" selected, respectively.
Select Years of Schooling as the explanatory variable and 2007 Median Hourly Wage Gain for the Additional Year as response variable. The slope and intercept of the regression equation can be found below the plot in the Coefficient Summary Table.