Confidence Intervals
A confidence interval is an interval of plausible values for a population characteristic. A confidence interval is constructed so that we have a chosen level of confidence that the actual value of the population characteristic will be between the lower endpoint and the upper endpoint of the interval. The confidence level is the success rate of the method used to construct a confidence interval.
The general formula for a confidence interval for a population proportion when
- is the sample proportion from a random sample from the population of interest,
- the sample size is large , and
- if the sample is selected without replacement, the sample size is small relative to the population size ( is at most 10% of the population size) is .
The desired confidence level determines which z critical value is used. The three most commonly used confidence levels, 90%, 95%, and 99%, use z critical values 1.645, 1.96, and 2.58, respectively. The width of the confidence interval is affected by each value in the formula.
Confidence Interval using SALT
In SALT, navigate to the Inferential Statistics tab and select the One Sample Proportion procedure. Enter the number of successes, , as an integer. (If a percentage is provided, use to convert the percentage to an integer, where is the number of trials.) Then enter the number of trials, .
Select the Confidence Interval option and enter the desired confidence level. Click Generate Results to return a One Sample Proportion Confidence Interval Summary, which displays the lower and upper limits of the confidence interval for .
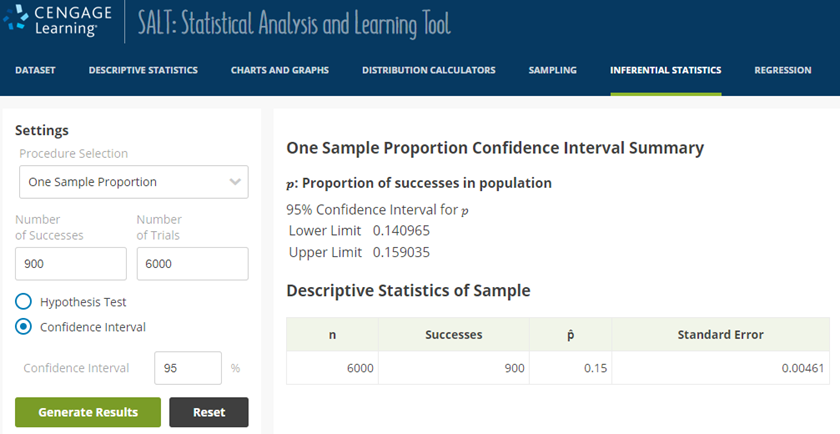
A screenshot of the SALT program is shown. On the menu bar at the top of the page, the tab labeled "Inferential Statistics" is selected. A partial view of the Inferential Statistics page is visible below, where a menu labeled "Settings" is shown on the left. In the Settings menu, a drop-down list labeled "Procedure Selection" has the option "One Sample Proportion" selected. Below the drop-down menu, two text entry boxes labeled "Number of Successes" and "Number of Trials" have the numbers 900 and 6,000 entered into them, respectively. Below the text entry boxes, a set of two radio buttons has buttons labeled "Hypothesis Test" and "Confidence Interval" with "Confidence Interval" selected. Below the radio buttons is a text entry box labeled "Confidence Interval" that has a percent sign following it and the number 95 entered into it. Below the text entry box are two buttons labeled "Generate Results" and "Reset." To the right of the settings menu is a data display labeled "One Sample Proportion Confidence Interval Summary" with text reading line by line as follows.
- p: Proportion of successes in population
- 95% Confidence Interval for p
- Lower Limit: 0.140965
- Upper Limit: 0.159035
- n: 6,000
- Successes: 900
- p̂: 0.15
- Standard Error: 0.00461