
Newton's Laws of Motion
Objectives
-
•to validate Newton's Laws of Motion
Equipment
- horizontal dynamic track and safety stopper on one end
- PASCO carts with a small reflector
- motion detector connected to the Science Workshop Interface
- lab stand
- balance
- two force sensors
Introduction and Theory
Newton's Laws are the essential part of Dynamics — the area of physics that studies the cause of motion experienced by an object. The interaction between objects is measured by a physical quantity — force. A force is a vector quantity and it can be presented as an arrow. The arrow shows the direction in which the force is being applied, and the length of the arrow shows the magnitude (size) of the force. The two types of forces are contact forces and field forces. Examples of contact forces are friction force, normal force, and tension force. Examples of field forces are gravity force and electromagnetic force. Usually there is more than one force applied to an object. To predict the type of motion an object will experience due to forces acting on it, a net force needs to be calculated. A net force is a vector sum of all the forces that act on the object. Newton's First Law states that an object will be at rest or will maintain constant velocity motion until a non-zero net external force acts on it. In other words, if the vector sum of all the forces applied to an object (or net force) is zero, the object stays at rest or is moving with constant velocity. The system of reference where this fact holds true is called an inertial system of reference. If the forces are not balanced (which means a net force does not equal zero), the object will move with constant acceleration, which will be directly proportional to the net force and inversely proportional to an object's mass. Newton's Second Law of motion can be summarized by the following equation:( 1 )
a =
,
| ΣF |
| m |
Procedure
Please print the worksheet for this lab. You will need this sheet to record your data.
Experiment 1 - Newton's First Law
1
Open the pre-set experiment file "Newton's First Law" located in the "pirt_inst_labs"- phy 113 folder — PreSetUp Labs.
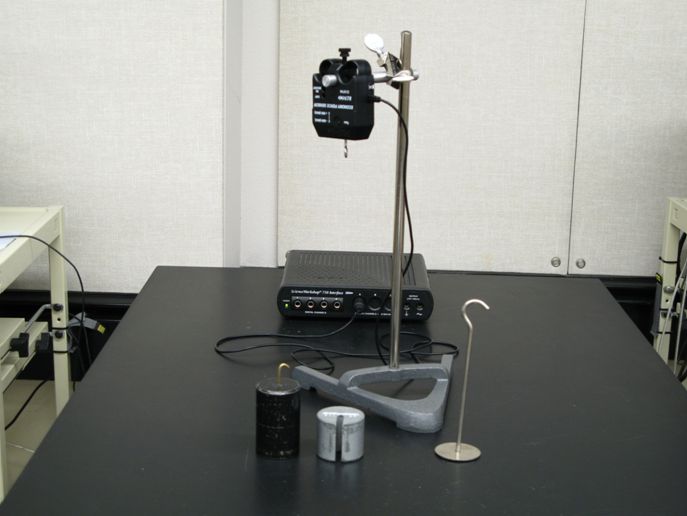
Figure 1
2
Take one of the force sensors. Hang the sensor from the provided lab stand. Connect the force sensor to Channel A of the PASCO Interface. Calibrate the force sensor to take measurements.
Force Sensor Calibration
With the force sensor hanging vertically, do the following.
With the force sensor hanging vertically, do the following.
-
•In the DataStudio® program, open "Setup". Choose "Calibrate Sensor". The Calibration window will open. Check that "2-point Calibration" is marked. Set the Standard value of Calibration point 1 to be equal to zero. With nothing hanging on the sensor, press the "Tare" button on the force sensor itself. Select "Read from Sensor" in DataStudio®.
-
•Set the Standard value of Calibration point 2 to be equal to 9.81 N. Select "Read from Sensor" in Data Studio. Click Ok. Close Experiment Setup Window.
3
Remove the force sensor from the stand and hold it vertically with your hand. Attach the mass hanger with a 500-g mass on it to the force sensor. Press the "Start" button. Hold the force sensor still. Collect data for 5 seconds.
4
Use the "Statistics" option to determine the mean value of the force while the mass is being held stationary. Report the mean value of the force (Tension) measured by the force sensor in the Experiment 1 portion of the Lab 4 Worksheet.
5
Calculate the force of gravity acting on the hanger and hanging mass. Report it in the Experiment 1 portion of the Lab 4 Worksheet.
6
In your lab report, you will need to find the net force acting on the hanging mass and explain how the obtained data proves Newton's First Law.
7
Draw the force diagram of the experiment on the Lab 4 Worksheet.
Checkpoint :
Check with your TA to see if your drawing is correct. Have your TA check the value of the net force and discuss the way you found it.
Check with your TA to see if your drawing is correct. Have your TA check the value of the net force and discuss the way you found it.
8
Upload the file with your graphs. Do a print screen and save the graphs as a file with a maximum
size of 1 MB. (You will upload this file in the WebAssign question.) Print the graph for your TA to sign, and for your reference.
9
Close the pre-set experiment file "Newton's First Law". Put the hanger and 500-g mass away.
Experiment 2 - Newton's Second Law
In this experiment, you will investigate the relationships of acceleration to net force.1
Place the track on the table. Put a PASCO cart on the track. To calibrate the sensor, open \Setup. Choose \Calibrate Sensor. The Calibration window will open. Check that \2-point Calibration is marked. Set the Standard value of Calibration point 1 to be equal to +50N. If the force sensor is calibrated, screw it to the top of the PASCO cart. Place the screw in the socket marked "cart". Place the lab stand with a motion sensor on it at the end of the track next to the PASCO Interface. Connect the yellow jack to Channel 1 and the black jack to Channel 2. Attach a black carton reflector to the end of the cart facing motion sensor.
To take measurements, you will need to hold the hook of the force sensor with your hand and make the cart move in a random fashion back and forth along the track.
2
Check that the track is leveled. To obtain good data, remember that the motion sensor cannot accurately detect objects that are closer than 0.15 m. Be sure to keep the cart farther away than this distance.
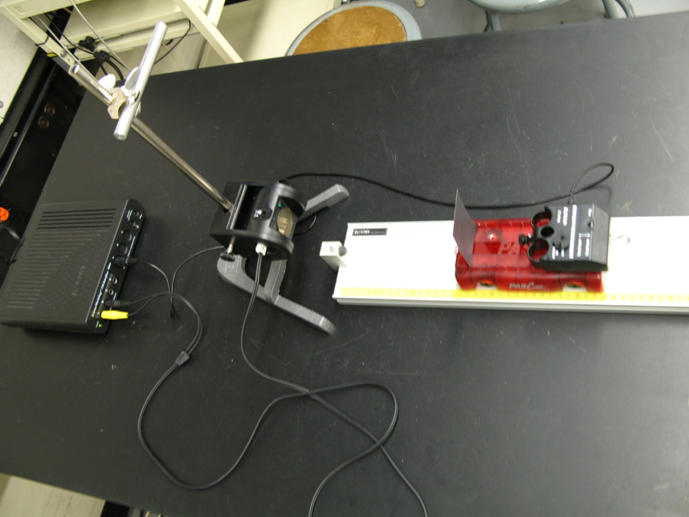
Figure 2
3
When the cart sits still, press the "Tare" button on the force sensor. You should press the
"Tare" button prior to each measurement.
4
Open the pre-set experiment file "Newton's Second Law" located in the "pirt_inst_labs"- phy 113 folder — PreSetUp Labs.
5
Click the "Start" button to begin collecting data. You should see a zero force reading. Holding the hook of the force sensor with your hand, make the cart move back and forth along the time the track for a 15-seconds time interval. You can vary the magnitude of the force you apply during this run. Click stop after a 15-second time interval has passed. You should see the force vs time and acceleration vs time graph produced in the DataStudio®.
6
Open Graphical Analysis (GA). Copy both of the experimental data (acceleration vs time; force vs time) between the 2s - 15s time intervals from DataStudio® into Graphical Analysis.
Hint: Click and hold the left button of the mouse to select data in the needed ranges. Use CTRL+C to copy the highlighted data. Use CTRL+V to paste data into GA. You should have 4 columns of data after you complete this step.
7
Name the columns in GA so they correspond to the copied data. Make appropriate adjustments to be sure that the pasted time intervals of acceleration and force are the same.
8
Chose acceleration and force as two variables on the y-axis, and time as a variable on the x-axis. In your lab report, you will have to discuss if the change in acceleration resembles the change in force within the selected time interval.
9
Insert new graph. (Hint: Insert — Graph). The graph is acceleration vs force. Apply linear fit. Record the slope of the graph and its uncertainty in Data Table 2 of the Lab 4 Worksheet. Discuss with your TA the relationship between the acceleration and the net force, as well as the relationship between the slope of the graph and the mass of the moving system. In the lab report, you will need to calculate the experimental mass (mexp) of the moving system (cart+force sensor) and compare it (calculate the percent discrepancy) with the theoretical mass (mtheor). Use the balance to measure the theoretical mass (mtheor) of the cart+force sensor.
10
Upload the file with your graphs. Do a print screen and save the graphs as a file with a maximum size of 1 MB. (You will upload this file in the WebAssign question.) Print the graph for your TA to sign, and for your reference.
11
Close pre-set experiment file "Newton's Second Law". Put the motion sensor away.
Experiment 3 - Newton's Third Law
In this experiment, you will compare the magnitudes and direction of forces acting on two interacting carts.1
Take the second force sensor and attach it on top of the second cart. Connect it to the channel B. Open the pre-set experiment file "3rd Law Tug-O-War Data" located in the in the "pirt_inst_labs"- phy 113 folder — PreSetUp Labs. Connect two force sensors with a string.
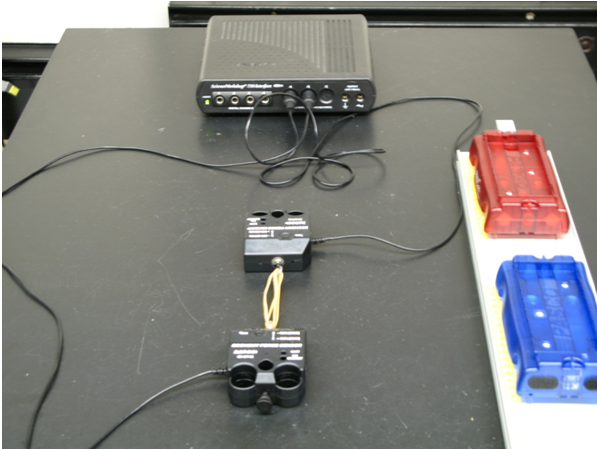
Figure 3
2
Click the "Start" button to begin collecting data. One person holds one cart still. A second person tugs on the other cart along the track. (Hint: the experiment should resemble a small-scale game of a tug-o-war with neither person winning). End data collection after 5 seconds.
3
Record the value of the forces (force of force sensor A on force sensor B; force sensor B on force sensor A) in Data Table 1 of the the Lab 4 Worksheet Lab. In the lab report, you will need to discuss the graphs forces vs time produced in the experiment.
4
Upload the file with your graphs. Do a print screen and save the graphs as a file with a maximum size of 1 MB. (You will upload this file in the WebAssign question.) Print the graph for your TA to sign, and for your reference.
5
Close the pre-set experiment file "3rd Law Tug-O-War Data".
6
Replace the hooks on both force sensors with the springs.
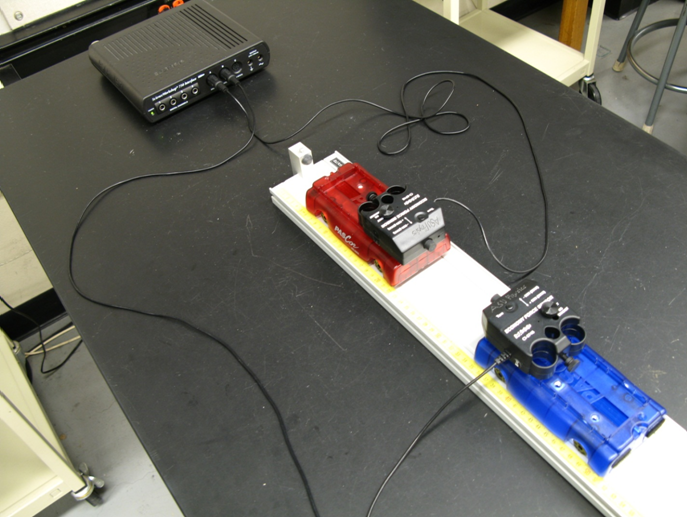
Figure 4
7
Open the pre-set experiment file "3rd Law Collision" located in the in the "pirt_inst_labs"- phy 113 folder — PreSetUp Labs.
8
With nothing connected to the Force Sensors, press the "TARE" buttons on the Force Sensors. Click "Start". Place the second cart in the middle of the track and add additional mass. Push the first cart towards the second one. Stop recording after the collision. Record the value of the forces (force of the cart A on the on the cart B; force of the cart B on the cart A) in Data Table 1 in the Lab 4 Worksheet. In the lab report, you will need to discuss the graphs forces vs time produced in the experiment.
9
Repeat step 8 by making the carts move towards each other. Record the data. In the lab report, you will need to explain how the data in this experiment proves Newton's Third Law.
10
Upload the file with your graphs. Do a print screen and save the graphs as a file with a maximum size of 1 MB. (You will upload this file in the WebAssign question.) Print the graph for your TA to sign, and for your reference.
11
Close the pre-set experiment file "3rd Law Collision". Bring the lab station to the original condition. Complete the InLab on the WebAssign.