
Module 8 – Refraction
Refraction
In the early 1600s, Galileo turned a small telescope to the sky and observed the mountains of the Moon, the phases of Venus, the rings of Saturn, and the rotation of the Sun. The result of his observations was to provide indisputable evidence that the geocentric model of the universe described by Aristotle and later Ptolemy could not be correct. Copernicus's heliocentric model, supported by Galileo's observations, eventually prevailed, and modern astronomy was born. Since that time, larger and more complicated telescopes have been built, providing us with a greater understanding of our place in the universe. Galileo's observations were made possible by one simple physical principle related to the wave nature of light—refraction. Refraction is the bending of light as it moves from one medium to another. This bending is due to a change in speed that occurs as the light moves between regions of greater or lesser optical density. Optical density is not the same as mass or weight density; instead, optical density is a measure of a substance's ability to transmit electromagnetic radiation. The more optically dense a material, the slower the electromagnetic wave will be transmitted. One indicator of optical density is the index of refraction, n, which is defined as the ratio of the speed of light in a vacuum to the speed of light in a particular medium.Dispersion
For all intents and purposes, all information about the composition and characteristics of stars is provided by electromagnetic radiation. For example, light leaving the Sun's surface passes through its cooler, more rarefied atmosphere, and when it does, some frequencies are absorbed.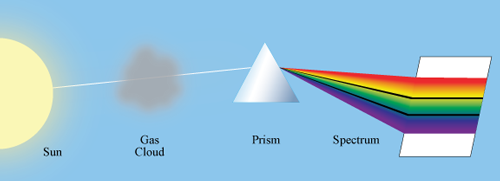
Figure 1
Spectral Colors:
Colors that can be produced by visible light of a single wavelength (monochromatic light) are referred to as the pure spectral colors. Although the spectrum is continuous, and, therefore, there are no clear boundaries between one color and the next, the ranges may be used as an approximation.
Colors that can be produced by visible light of a single wavelength (monochromatic light) are referred to as the pure spectral colors. Although the spectrum is continuous, and, therefore, there are no clear boundaries between one color and the next, the ranges may be used as an approximation.
-
Color Wavelength
(nm)Frequency
(THz)Red 630–750 400–476 Orange 590–630 476–508 Yellow 560–590 508–536 Green 490–560 536–612 Blue 450–490 612–667 Violet 400–450 667–750
| λ | = | 380 nm | ||||
| = | (380 nm)
| |||||
| = | 380 × 10−9 m | |||||
| = | 3.80 × 10⁻⁷ m |


| f | = |
| ||
| = |
| |||
| = | 0.789 × 10¹⁵ Hz | |||
| = | 789 × 1012 Hz | |||
| = | 789 THz |
NOTE:
As the wavelength increases, the frequency decreases, and vice versa.
As the wavelength increases, the frequency decreases, and vice versa.
Reflection
The ability of a telescope to gather light and show detail depends on its size; the larger the telescope, the brighter and sharper the image. Large refracting telescopes are heavy and expensive to build; in addition, they suffer from chromatic aberration, a consequence of the dispersion of light. So while Galileo used a telescope based on the principle of refraction, modern telescopes rely on the physical phenomena of the reflection of light.Total Internal Reflection
An interesting phenomenon that relates reflection to refraction is the phenomenon of total internal reflection. Total internal reflection only occurs when light is passing into an optically less dense material at a high angle of incidence. Optical fibers rely on total internal reflection.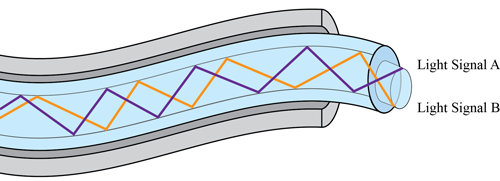
Figure 2: Light traveling along an optical fiber
Procedure
You will observe the experiment performed and fill in your data sheets.1
Open the experiment instructions and worksheet.
-
•Refraction Experiment Instructions (HTML or PDF)
-
•Refraction Experiment Worksheet
2
After you have opened the instructions and worksheet, select and watch the Experiment Video (the Experiment Video is available in your course LMS).
3
Record your data in the worksheet. (You will need it for the lab report assignment in WebAssign.)