
Macroscopic and Microscopic Springs – Procedure
Objective
Purpose
In this lab you will:-
•investigate the spring-like properties of a straight wire,
-
•discover the "stretchiness" of a material, independent of the size and shape of an object,
-
•relate macroscopic "stretchiness" of a material to microscopic "stiffness" of the interatomic bonds.
Questions to Explore
-
1Is a solid metal, straight wire like a spring? If so, in what ways? If you consider the wire to be a spring, how does spring stiffness compare to the coiled springs used in the previous lab?
-
2How can one express the spring-like properties of the particular metal in a way that is independent of the size, shape, and physical dimensions of the wire (Young's modulus)?
-
3How can one relate the macroscopic spring-like properties of the particular metal to the stiffness of that metal's interatomic bonds (interatomic spring stiffness).
Equipment
- a straight metal wire stretched on a frame, with a hanger for weights
- a millimeter scale for determining the position of the end of the wire
- Vernier caliper (for how to read — see the Measuring with Vernier Calipers section below)
Procedure
Please print the worksheet for this lab. You will need this sheet to record your data.
Experimental Setup
Recording Data
1
Right click on the Excel® file "youngs modulus.xls," and save it to My Documents. Double-click the file to open it in Excel®.
2
You should see a display that includes places for your group information, measured values, and calculated values, as well as a space for your graph.
3
You will record all of your data and analysis on the Excel® sheet and submit it to WebAssign to
be graded by your TA.
Measuring with Vernier Calipers
In this laboratory exercise, you will be using a Vernier caliper, which is comprised of two "teeth," one attached to a fixed scale and the other attached to a sliding (Vernier) scale. In order to measure an object's width, the object is simply placed between the caliper's two teeth. The sliding tooth is then moved until the object is pressed tightly between the teeth. Using both scales, the width can be read to the nearest 0.005 cm (or 0.05 mm). The scales are read as follows (refer to the figure).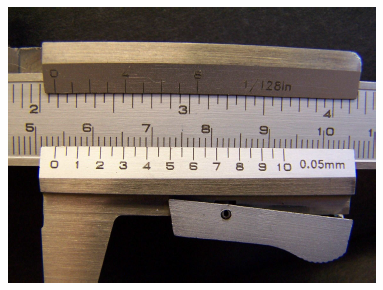
Figure 1: Vernier Calipers
4
Find where the 0 mark of the sliding scale lines up on the fixed scale. In this case, it is just past the 5.3 cm mark. So, the first reading is 5.3 cm.
5
Find the mark on the sliding scale that most closely lines up with one of the marks on the fixed scale. Here, 5.0 and 6.0 are very close, but 5.5 lines up best with one of the marks on the fixed scale. This value is the number of hundredths of centimeters (or tenths of millimeters). So, the second reading
is 0.055 cm.
6
Add the two values together to get the total reading: 5.3 cm + 0.055 cm = 5.355 cm.
At this website, the label on the sliding scale is misleading. The scale is labeled "mm," which leads the user to think that the numbers on that scale represent millimeters. This is NOT correct. As described above, the numbers on the sliding scale represent tenths of millimeters.
Measurements
Dimensions of the Wire
One of the goals is to describe the "stretchiness" of a material independent of the size and shape of the wire. To do this, we first need to know the physical dimensions of the wire.1
Measure the following and enter your data into your Excel® sheet.
-
aEntire length of the wire without any weights on it
-
bDiameter of the wire using the caliper (see section above Measuring with Vernier Calipers)
-
cUsing the measured diameter of the wire, calculate the cross-sectional area of the wire.
Checkpoint:
Compare your data with another group to make sure it is reasonable.
Compare your data with another group to make sure it is reasonable.
Stiffness of the Wire
To determine if the straight wire behaves like a spring, you need to measure the position of the end of the wire as you add different amounts of weight.2
Remove the kinks in the wire.
-
aAdd 6 kg to the platform hanging from your wire. Remove the 6 kg. Repeat. This helps get small kinks out of the wire, so the "straight" wire doesnt act like a coiled spring.
If the wire has kinks in it, you will measure the springiness of the "coiled" wire instead of the stiffness of a straight wire. Remove the kinks before starting your measurements.
3
Take the following measurements and record your data in your Excel® sheet.
-
aLook at the scale on the apparatus, and make sure you know what the divisions are and how to read the scale. You should be able to measure to the nearest 0.1 mm.
-
bYou need to make three sets of measurements, so that you can get average values.
-
iTake measurements with 0 kg, then 2 kg, 4kg, 6kg.
-
iiTake all the masses off and start from zero again, taking the same measurements twice more.
-
iiiTake the average of your three sets of measurements.
-
-
cCalculate the variation of your measurement.
-
iThe variation in the measurements (the "reproducibility") gives you an indication of how meaningful the individual measurements are. Record your estimate of the variation.
-
•If the measurements are 5.5, 5.7, 5.4, 5.6, 5.8, and 5.6 mm, the average is (5.5 + 5.7 + 5.4 + 5.6 + 5.8 + 5.6)/6 = 5.6, from a minimum of 5.4 to a maximum of 5.8.
-
•A compact way to report this average with the approximate variation is 5.6 ± 0.2 mm.
-
-
iiIf the variation is larger than 0.3 mm, you MUST repeat your measurements.
-
•Discard earlier measurements since this was probably getting more kinks out of the wire.
-
-
4
BEFORE graphing your data, discuss the following questions with your group members.
-
aIf the wire acts like a spring, what would you expect a graph of stretch versus force to look like?
-
bHow could you determine the spring stiffness of the wire from the graph?
5
Use your data to make a graph in Excel® of the stretch of the wire (on the y-axis) versus the force exerted on the wire (on the x-axis).
-
aBoth of these quantities will need to be computed from your data (either by hand or using Excel®).
-
bFrom the two columns representing stretch and force, highlight the cells with the data for 2, 4, 6 kg.
Do NOT include the data for 0 kg, because the wire may be kinked without a load.
-
cChoose menu option Insert → Chart, and choose 'XY (Scatter).' (Do NOT choose a 'Line' chart.)
-
dBe sure to verify that you have the proper quantities on the proper axes.
-
eFit your data to a 'Trendline.'
-
iRight click on one of the data points and select 'Add Trendline.'
-
iiChoose 'Linear' under 'Type.'
-
iiiUnder 'Options,' choose 'Display Equation on Chart' — this will display the equation of the line that best fits your data in the formy = mx + b.You can reposition the equation.
-
-
fFrom your data, determine the spring stiffness of the wire.
-
iSinceF = Kss,thens =so the slope of your graph is equal to
F,1 ks 1/ks.
-
Checkpoint:
Compare your measurements, calculations, and graph with another group to verify that they are reasonable.
Compare your measurements, calculations, and graph with another group to verify that they are reasonable.
"Stretchiness" of the Metal
Calculating Young's modulus is a way to measure the "springiness" or "stretchiness" of the metal and factor out the size and shape of the particular wire.6
BEFORE calculating Young's modulus, discuss the following questions with your lab partners and write your answers on a whiteboard.
-
aIf the cross-sectional area of the wire were doubled, would the wire stretch more, less, or the same amount when you hung a 2 kg mass on it? Why?
-
iThink about putting two of your original wires together side by side.
-
iiHow does this compare to placing two springs in parallel?
-
-
bIf the wire were twice as long, would it stretch more, less, or the same amount when you hung a 2 kg mass on it? Why?
-
iThink about connecting two of your original wires end to end.
-
iiHow does this compare to placing two springs in series?
-
-
cThe quantity F/A is called "stress." What are its units?
-
dThe fractional stretch ΔL/L0 is called "strain." What are its units?
Checkpoint:
Compare your responses with another group.
Compare your responses with another group.
7
Use the measurements for your wire to determine Young's modulus.
-
aAt equilibriumF = ksΔL = s,so:
-
bUse your measurement for the initial length, your calculated value for the cross-sectional area, and the value for the spring stiffness obtained from your graph to determine Young's modulus for the material of which your wire is made.
-
cShow your calculation on your whiteboard and record your result on your Excel® sheet.
-
dHow does your value for Young's modulus compare to that of aluminum (6.2 × 10¹⁰ N/m2) or lead (1.6 × 10¹⁰ N/m2)? Given that the wire is brass (an alloy of copper and zinc), is your value reasonable?
Checkpoint:
Compare your results with another group.
Compare your results with another group.
Determining the Interatomic Spring Stiffness
Young's modulus is a way to relate the macroscopic spring-like properties of the particular metal to the stiffness of that metal's interatomic bonds (interatomic spring stiffness).8
BEFORE determining the interatomic spring stiffness, discuss the following with your partners.
-
aAssuming a simple "ball and spring" model for our solid, how could we determine the length of the interatomic bonds if we knew the density of the material? (Hint: You have probably done something similar in your homework recently.)
-
bUsing this idea and the following information, determine the length of the interatomic bond for brass.
-
•Brass is an alloy of copper and zinc.
-
•The atomic mass of copper is 64 grams/mole; zinc is 65 grams/mole.
-
•The density of copper is 8.94 grams/cm3, for zinc, it is 7.14 grams/cm3.
-
•Note: beware of your units.
9
Use your calculation of the interatomic bond length and your value for Young's modulus to approximate the stiffness of the interatomic bonds, ks,i.
-
aIn the "Stretchiness" of the Metal section above, we showed:
-
bFor our "ball and spring" model, the cross-sectional area of the bond is A = d2 and the relaxed length is L0 = d (if you are unsure why this is, reread the Interatomic Spring Stiffness section from Macroscopic and Microscopic Springs – Concepts). Thus:
-
cShow your calculation on your whiteboard and record your result on your Excel® sheet.
Checkpoint:
Compare your results with another group.
Compare your results with another group.
10
Submit your Excel® sheet and answer the follow-up questions in WebAssign.