
Air Resistance – Procedure
Equipment
- Three small coffee filters
- Three large coffee filters
- Meterstick
Overview
Reading all of the Procedure before starting will make the experiment much easier!
-
1You will measure the speed of several moving objects of different masses and sizes.
-
•The objects will be stacks of 1, 2, or 3 coffee filters, either large or small size.
-
-
2You will determine the magnitude of Fair, the air resistance on each object.
-
3You will graph |Fair| versus v in Excel®.
-
4You will fit the trend line to a power-law curve to find the value of the exponent n in the following equation.
Procedure
Please print the worksheet for this lab. You will need this sheet to record your data.
Due to the nature of this lab, you will be recording your data, calculations, and graphs in an Excel® spreadsheet. You will upload this spreadsheet in WebAssign.
Terminal Speed
Without a motion detector, the best way to measure the speed is to wait for the speed to become constant. Why will the speed become constant?-
•If the air resistance force increases as the speed increases (as equations (1) and (2) in Air Resistance – Concepts indicate), eventually the air resistance force will become equal in magnitude to the gravitational force on the object. At this point, the net force on the object is zero and the object's speed stops changing. This speed is called terminal speed, vT.
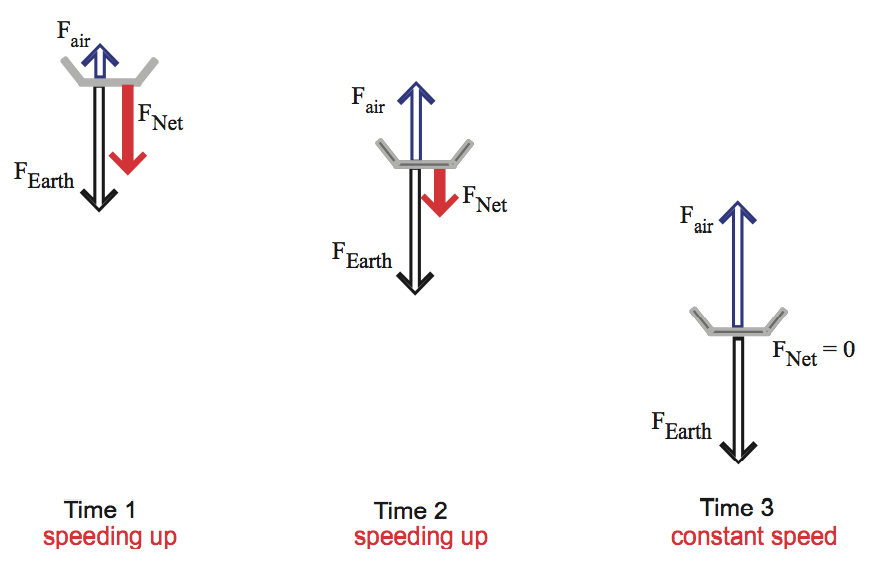
Figure 1
|Fair|
increases (Time 1 and Time 2), until |Fair| = |Fgrav|
(Time 3). Once the net force is zero, the filter has reached terminal speed.
1
Record the mass of the filters.
2
Measure the terminal speed.
-
aDrop the object (1, 2, or 3 filters) from a high location.
-
bTo make sure terminal speed has been reached, time only the last meter of the fall.
-
cRepeat each measurement 4 times, and then average them to get better measurements.
3
Repeat Step 2 for each object (24 measurements in all).
Determining the Magnitude of |Fair|
Once terminal speed is reached, |Fair| = |Fgrav|.1
Calculate |Fair| for each object.
Graphing the Data
1
Use the provided Excel® spreadsheet to organize your data.
2
Make a graph for the small filters and a second graph for the large filters.
-
aTo make a graph, click "Charts" on the ribbon or select "Chart..." from the "Insert" menu.
-
bUse a scatter plot (not a chart with the points connected) with force on the y-axis and terminal speed on the x-axis.
Finding the Speed Dependence
1
For each size of filter, use a power-law fit to determine the value of n.
-
aRight click on the data or go to the "Chart" menu and select "Add Trendline."
-
bIn the trendline type, select "power," and in options, click the checkbox to display the equation.
-
cThis will fit the data to equation 1|Fair| = constant · vn, allowing you to determine the value of the exponent, n.
Results
1
Compare your results to the equations in Air Resistance – Concepts. Which one seems to be a better fit for modeling the air resistance of the falling filter? Was there a significant difference between the different filter sizes?
2
Turn in the Excel® file with your data and graphs in WebAssign.
Questions
The full equation for the model of air resistance that uses v2 is where Cd is a drag coefficient, ρ is the density of air, and A is the cross-sectional area of the leading surface.1
How does this equation match up with your data? Fill in Table 3 using one set of terminal speed and force of air data from each filter type. You will need to determine the relevant area for the filter, and look up data for the density of air. The drag coefficient for a circular leading surface is approximately 0.47 (the ruffles make the shape more complicated, but this can be used as an approximation).
2
Judging by the percent difference between your measured force of air resistance and your calculated value using this method, how would you say this model fits your data? Is the fit better for the large or small filter? Why might that be? What sources might contribute to the difference you encountered?