
Speed of Sound
Objective
In this lab, you will use simple measurements and calculations to determine the speed of sound in air, and then compare your results with theoretical predictions. This experiment should be very straightforward, but be sure to read all the steps of the instructions.Equipment
- Two sound sensors
- Meterstick
- Data interface box
- Computer
- DataStudio® program
Procedure
Please print the worksheet for this lab. You will need this sheet to record your data.
Equipment Setup
First, you'll need to set up the sensors.1
Plug the two sound sensors into the analog channels labeled A and B on the PASCO ScienceWorkshop® interface box, if they're not already connected.
2
Open the DataStudio® program from the desktop or Start menu.
3
Choose to create a new experiment.
4
When you see a picture of the interface box, click on channel A to add a sensor, and
choose "Sound Sensor."
-
•It has a picture of an ear and a sound wave, just like the picture on the sensor itself.
5
Repeat the process for channel B.
6
Click on each sensor and make sure the sampling rate is set to 5000 Hz.
-
•Once both sensors are added, you can close the setup box.
7
On the lower left side of the DataStudio® window, there are a list of options, one of
which is "Graph."
8
Double click on "Graph" and select channel A. Repeat to make a second graph for
channel B.
-
•You should now have two voltage vs. time graphs. The voltage corresponds to the intensity (loudness) of the sound being detected by each sensor.
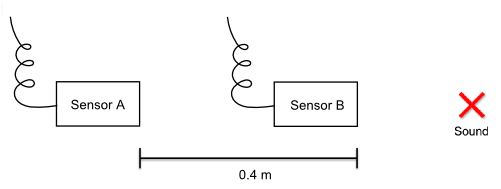
Figure 1
Experiment
Once you're ready to begin collecting data, complete the following steps.1
Place the two sound sensors on the table with their microphone openings 0.4 m apart.
-
•Have both sound sensors pointing in the same direction.
2
Click "Start" on DataStudio® to begin recording, and then make a sharp noise to the side of the sensors.
Note the following tips.
-
•Make sure to make the noise to the side of the sensors, not between them.
-
•A clap or loud snap works very well and is easy to see on the graphs.
-
•Striking the table to make a noise is not a good idea, since the table will transmit the vibration at a very different speed than the air.
-
•See Figure 1 for an example of the arrangement. The idea is that the sound will take some amount of time to travel to sensor A, and a longer time to travel to sensor B, with the difference in times being the amount of time to traverse the 0.4 m separating them.
-
•Note: DataStudio® is taking 5000 data points per second per sensor. It can only run for a few seconds like this, so be ready to make the noise right after clicking "Start."
3
On your graphs, you should see a spike corresponding to the noise for each sensor. If not, repeat the measurement.
4
One of the buttons at the top of the graph is the "Smart Tool." (You can see what
each tool is by holding the mouse icon over the button for a few seconds.) Click on the
"Smart Tool" for each graph.
5
Drag the "Smart Tool" to the highest point of the spike on each graph and determine the
time value (x-coordinate) at the peak. This is the time when the main sound wave reached the sensor.
6
Record the times in the data table as t1 and t2. Keep all the digits DataStudio® reports so as to get accurate results.
Always make the larger number t2.
7
Subtract t2 from t1 to get the time for the sound wave to travel from one sensor to the other.
8
Since this measurement is very sensitive (the travel time will be on the order of
milliseconds), you will repeat this measurement two more times and average the Δt values together.
9
Move the sensors so they're 0.8 m apart and repeat all parts of the measurement.
10
Repeat for distances of 1.2 m and 1.6 m. Fill in the data table.
Analysis
The easiest way to determine the speed of something is to measure the time it takes for it to travel some distance. With this setup, we now have measurements of how long it took the sound to travel the distance between the sensors, and can calculate its speed.11
You will use linear regression to determine the speed of sound. Think about what equation you would use to determine this, and what measured values you would need to plot on a graph in order for the slope of your trendline to be the speed. Use Excel® to make the calculations or plot the graph, and see the separate document on linear regression if you need help using Excel®.
The theoretical speed of sound in dry air, treating sound as an ideal gas, is dependent
on temperature and can be roughly calculated from this equation
where T is the air temperature in °C.
12
Estimate the air temperature of the room. You can convert this to °C with an online converter or the equation °C =
.
| (°F − 32) |
| 1.8 |
13
Use this estimate to determine a theoretical speed of sound in air and compare it to your measured value. See the separate document on percent error if you need help on the last calculation.