
Lab 2 - Emission and Absorption
Purpose
-
ATo determine the identities of ions in two solutions of unknown composition by comparing the colors they produce in flame tests with colors produced by solutions of known composition.
-
BTo determine the relationship between the color of a solution and the absorption spectrum of the solution.
Goals
-
1To gain practice using a Bunsen burner.
-
2To observe flame test colors produced by ions in solution.
-
3To compare flame test colors produced by known ions in solution with those produced by unknown ions in solution.
-
4To use deductive reasoning to identify the unknown ions in a solution.
-
5To gain experience using a spectrophotometer.
Introduction
When many people hear the word radiation, their first thought is something radioactive. However, a scientist thinks about energy moving through space in a series of waves called electromagnetic (EM) radiation or radiant energy. We are surrounded by electromagnetic radiation. Natural sources of radiation from the sun, radioactive decay, and even the luminous glow from fireflies contribute to the electromagnetic radiation around us. Artificial sources such as radio and television, microwave radar detection systems, telephone signals, light bulbs, and medical equipment are also contributors. We have learned a great deal about nature and the structure of the atom by monitoring radiation with microscopes, telescopes, and other scientific equipment. The continuum of this radiation is known as the electromagnetic spectrum. It includes gamma rays, x-rays, ultraviolet light, visible light, infrared light, microwaves, and radio waves. Human vision is limited to the very narrow band of visible light. Electromagnetic radiation can be described as a wave characterized by two inter-dependent variables:- frequency, ν (nu), is the number of waves passing a certain point per second. Frequency is measured in Hertz (Hz). 1 Hz = 1 cycle/sec.
- wavelength, λ (lambda), is the distance between a point on one wave and the corresponding point on the next wave. Wavelength is measured in units of length, which are convenient for the type of radiation being considered. Radio waves are measured in meters (m). Visible and ultraviolet light are measured in nanometers. 1 nm = 10–9 m.
( 1a )
c = λν = 3.0 × 10⁸ m/s
c = λν = 3.0 × 10⁸ m/s
below:
( 1b )
| c |
| λ |
( 1c )
| c |
| ν |
( 2 )
E = hν
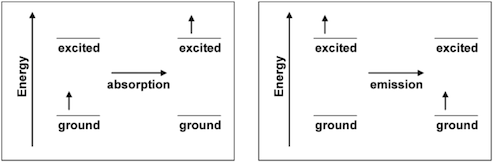
Figure 1: Absorption and Emission
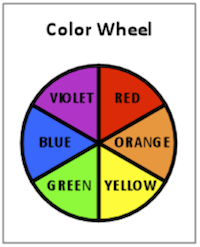
Figure 2: Color Wheel
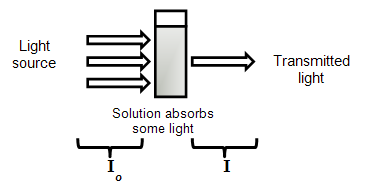
Figure 3: Diagram of a Spectrophotometer
| I |
| Io |
A = −log(T)
and 3bA = −log
. An absorption spectrum is often shown as a graphical plot of the amount of light absorbed versus wavelength.
 |
| I |
| Io |
 |
( 3a )
A = −log(T)
( 3b )
A = −log
|
| I |
| Io |
|
( 4 )
| MgBr2 (s) → | Mg2+ (aq) | + | 2 Br − (aq) |
| cation | anion |
Equipment
-
1Bunsen burner
-
1Nichrome wire loop
-
130 mL beaker
-
1spot plate
-
1grease pencil
-
1deionized water squirt bottle
-
1MicroLab spectrophotometer
Reagents
-
15 mL3 M HCl (aq)
-
5 dropseach known salt solution (0.1 M)
-
5 dropseach unknown salt solution (0.1 M)
-
Sample vials of:water Sunset Yellow FCF (FD&C Yellow #6) Indigo Carmine (FD&C Blue #2) Tartrazine (FD&C Yellow #5) Methyl Violet indicator Allura Red AC (FD&C Red #40) green food coloring
Safety
Read the procedure for operating a Bunsen burner in Lab Equipment. Know how to set it up, light it, and operate it safely. You will be working with hydrochloric acid, HCl (aq). This chemical is corrosive. If you spill it on a surface, wipe it up with paper towels and rinse with water, taking care not to touch the liquid. If you spill it on yourself, immediately rinse the area with plenty of water for 15 minutes. If it gets in your eyes, flush them with water for at least 15 minutes at the eyewash station and have someone notify the TA. The colored dye samples are in sealed vials which should not be opened. All the dyes except for Methyl Violet are currently in U.S. food sources. If you spill the vial contents on yourself, immediately rinse the area with plenty of water for 15 minutes. If a solution gets in your eyes, flush them with water for at least 15 minutes at the eyewash station and have someone notify the TA. Students will have access to gloves due to the use of 3M HCl during the lab period.Waste Disposal
The flame test solutions used in this experiment and the HCl in the beaker can be disposed of down the sink followed by flushing with plenty of water. The vials containing dye solutions should be returned to their sample container. No disposal is necessary.Prior to Class
Please read the following section in Lab Equipment: Please review the following video: Please complete your WebAssign prelab assignment. Check your WebAssign account for due dates. Students who do not complete the WebAssign prelab assignment are required to print and hand in the prelab worksheet
Part A Lab Procedure
Please print the worksheet for this lab. You will need this sheet to record your data.
1
Obtain a wire loop and a spot plate from the set-up area. Using a grease pencil, label the wells on the spot plate with the formulas of the solutions you will be testing. (See Data Table A for their names.) Make careful note of the unknown numbers you use.
2
Obtain 10 - 15 mL of 3 M HCl in a 30 mL beaker. Add 5 drops of each of the known solutions and the unknown solutions to separate wells of the spot plates. Be sure to match the solution to the properly labeled well!
3
Set up a Bunsen burner. Make sure it is not at the edge of the bench, under the Plexiglas shield, or under the shelf above the bench. Light the burner and adjust it to a compact flame. Never leave a lit Bunsen burner unattended!
4
Clean the wire loop as follows: Dip the loop end of the Nichrome wire into the HCl (aq) in the beaker and stir the acid gently for a few seconds. Then heat it in the hottest part of the Bunsen burner flame until it glows. When no color is imparted to the flame, the wire is clean. You may have to repeat this process a couple of times. Note that the acid wash accomplishes the cleaning, so give extra attention to this procedure. Also, some clean wires impart a pale yellow color to the flame.
5
Dip the clean metal loop into the well of the solution to be tested and bring the loop (slowly) to the hottest portion of the Bunsen burner flame. Observe and record in Data Table A the color imparted to the flame. Watch carefully since some colors are very fleeting while others last a relatively long time. Color descriptions might include bright red, deep red, orange-red, orange, yellow, yellow-green, green, blue, and violet.
6
Repeat steps 4 and 5 for each of the known solutions; from the data, determine which of the ions present is responsible for the color noted.
7
Test the unknown solutions in the same manner and identify the ions in the unknown. You may wish to look at one or more of the known solutions again if you are not completely sure of the identity of the unknown.
8
When you are finished making your observations, turn off your Bunsen burner, rinse and dry your spot plate, and return all equipment to the set-up area where you found it.
Part B Lab Procedure
1
Make sure that the MicroLab interface is connected to the computer and that the power is turned on.
2
Double click on the MicroLab528 icon on the desktop to open the software. A box will appear to choose an experiment. Highlight "Beer's Law Concentration" and click "OK". Click "OK" again to accept settings.
3
The spectrophotometer is calibrated from a blank solution. Place a vial containing the blank solution (water) in the spectrophotometer and cover the opening with the black tube provided to avoid incident light sources. Then click "Read Blank". It takes approximately 30 seconds to calibrate and the progress will be shown on the screen. During this time, do not remove the cover on the vial.
4
When finished, the spectrophotometer will display the transmission spectrum of water on the screen. Since water is clear and colorless, all colors should be represented. Fill in Data Table B with the visible wavelengths from 395 to 700 nm that are associated with each color.
5
Remove the blank water from the spectrophotometer.
6
Visually observe the apparent color Tartrazine, and enter your observation in Data Table C. This is your visual transmittance spectrum. Then place the sample in the scanning well and replace the black tube to cover. Select "Add Sample" on the MicroLab software and enter the name "Tartrazine", followed by selecting "Scan".
7
The spectrophotometer will display the transmission spectrum. To measure absorbance, select "Absorbance (–log T)" at the top of the window. Determine the absorbance maximum (peak or bar of greatest height) in the visible region from 395 to 700 nm and record it in Data Table C.
8
Repeat the procedure with the remaining 5 samples. Please note that the green food dye sample will have two major groups of peaks.
9
Before leaving, go to a computer in the laboratory and enter your results in the In-Lab assignment. If all results are scored as correct, log out. If not all results are correct, try to find the error or consult with your teaching assistant. When all results are correct, note them and log out of WebAssign. The In-Lab assignment must be completed by the end of the lab period. If additional time is required, please consult with your teaching assistant.