
How Do We Get Light from Matter: The Origin of Emission Lines
Organization
-
•Pre-Lab: "Origins of Lines"
-
•Mode: inquiry, groups of 2
-
•Grading: lab notes and post-lab questions
-
•Safety: no special requirements
Goal:
To examine the relationship between electron transitions and emission of light from various sources.
To examine the relationship between electron transitions and emission of light from various sources.
I: Background
See all pre-lab exercises to this point for background material.II: Exercises
You will be moving between different stations to observe the profile of light emitted from different type of sources of light. You'll be observing these sources of light with your eye, with an Ocean Optics spectrophotometer using a fiber optic cable and a visible light detector, and/or with a handheld spectroscope, using your eye as the visible light detector.
Please take a moment to read through the introductory material—it will reduce frustration and help you organize and plan your work.
Part A: Stations
You can move between the stations in any order, but here is the list of light sources you will be observing.-
•Station A: Everyday Sources of Light—light bulbs, CFLs (compact fluorescent lamps), overhead fluorescent lights, sunlight, light emitted from a computer screen.
-
•Station B: Semiconductor Sources of Light—light emitting diodes (LEDs).
-
•Station C: Atomic Sources of Light—gas-discharge lamps
-
1.How can you distinguish each of the three types of light sources you examine?
-
2.How does the color of light seen with your eye and the number and width of peaks seen with the spectrophotometer differ between the different light sources?
Part B: Use of the Equipment
Ocean Optics Spectrophotometer:
The instructions are near the computers. One person aims the cable, the other operates the computer.
The instructions are near the computers. One person aims the cable, the other operates the computer.
-
1.The instructions are near the computers. One person aims the cable, the other operates the computer.
-
2.Make sure the computer is on (select the "classes" login if needed) and the Spectra Suite software is launched.
-
3.Aim the fiber optic cable at the source of light.
-
4.Start collecting the spectrum by either pushing the F3 button on the keyboard, or by moving the mouse to the green triangle "Start" button.
-
5.Move the fiber optic cable closer or further away to increase or decrease the intensity of the spectrum as needed.
-
6.When the spectrum looks good, push the F3 button on the keyboard or move the mouse to the "Stop" button to freeze the spectrum on the screen.
-
7.Click on the spectrum to put a cursor in the screen. Move the cursor by moving the mouse and clicking the new position. The value of the wavelength is displayed in a box to the left and below the spectrum.
-
8.If you want to collect a different spectrum, push the F3 button again—this replaces the previous spectrum.
-
9.To add another spectrum to the same graph, click on the spectrum icon, hit "Accept", and push F3—note, this function can be a bit tricky when storing the next spectrum.
-
10.When in doubt, if you need to clear the spectrum or spectra, just exit the software and open it again.
Part C: Observations
What do you want to observe for each light source? You can make these observations in any order.-
•the color of the light with the naked eye
-
•the diffraction pattern through the handheld spectroscope
-
•Describe what you see, including the colors and appearance of the specral profile.
-
•Do you see bands of color or lines of color?
-
•Do you see gaps between colors?
-
•What colors do you see?
-
•Are there regions more intense than others?
-
-
•the spectral profile using the Ocean Optics spectrophotometer
-
•Sketch the spectrum between 400 and 800 nm using the template below (reproduce in your notebook). You can ignore peaks below 400 nm or above 800 nm.
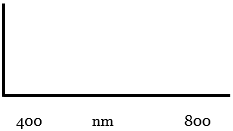 Figure 1
 -
•Use the cursor to measure the width of the peak seen or the width of the most intense peak in the spectrum, if there are multiple peaks.
-
•Use the cursor to measure the wavelength of the most intense peak or the wavelength at the most intense part of a peak, if only one peak is seen.
-
| violet light | 400 nm < λ ≤ 450 nm |
| blue light | 450 nm < λ ≤ 490 nm |
| green light | 490 nm < λ ≤ 560 nm |
| yellow light | 560 nm < λ ≤ 590 nm |
| orange light | 590 nm < λ ≤ 635 nm |
| red light | 635 nm < λ ≤ 700 nm |
Part D: Questions for Stations
Station A: Everyday Sources of Light
View these different sources of light (but do NOT look at the sun with your eye—the residual light coming in the window should be sufficient) with the handheld spectroscope and the Ocean Optics spectrophotomer. To gather the spectrum of sunlight, point the end of the fiber optic cable at the window. If it is a foggy day, you may or may not see a strong spectral profile for sunlight. Once you've made observations on all of these everyday sources of ight, move to an open area in the lab to answer the following questions.-
1.Describe the similarities and differences of the spectral profiles of the incandescent light bulb and sunlight. Be quantitative—what is the width of the peak(s) seen? What is the wavelength of the most intense region of the spectrum?
-
2.Describe the similarites and differences of the spectral profiles of the CFL and the fluorescent lamp in the ceiling. Be quantitative—what is the width of the peak(s) seen? What is the wavelength of the most intense region of the spectrum?
-
3.Compare the incandescent light emitters (incandescent light bulbs and the sun) and the fluorescent light emitters (CFL and overhead fluorescent lights) observed in Station A. How are these sources of light similar to each other? How are they different?
-
4.Is the computer screen more similar to an incandescent or a fluorescent source of light? What is your evidence to support your conclusions.
Station B: Semiconductor Sources of Light
There are several strips of LED lights at this station. Observe at least three colors with the Ocean Optics spectrophotometer. TIP: LEDs are directional—light is not emitted in a sphere, so the best viewing with the spectroscope is to aim the cable down at the LED. To isolate one color from another, roll a piece of paper into a cylinder and place it around the LED. Aim the fiber optic cable down the cylinder. You can also try viewing the LED with the handheld spectroscope aimed down the cylinder, but this can be a bit tricky, because the LED bulb is small and can therefore be difficult to line up with the slit. When you measure the width of the peak(s), write down the wavelength at each side of the peak, as well as the wavelength at the most intense region of the peak. Once you've made observations on the LEDs, move to an open area in the lab to answer the following questions.-
1.What is the average width of the peak seen for the LEDs you observed?
-
2.Does the peak correspond to a specific color in the visible region? Be quantitiative about your analysis—look at the reference material at the start of the lab to assign each peak a particular color. Is that assignment consistent with the color observed with your eye?
Station C: Atomic Sources of Light
There are two stations with three gas-discharge lamps, one with handheld spectroscopes and one with the Ocean Optics spectrophotometer. Go to each station and observe the three lamps in any order. Each tube has a label identifying the compostion of the gas inside the tube—record the lamp you are observing. Make a note of the following.-
•the color of the light seen with your naked eye
-
•The number of peaks seen with the handheld spectroscope and the colors of the peaks seen (if more than 7, you can just say several, or a lot). Note, though, that the spectrosopes sometimes do not work well with some of the less bright lamps, because the intensity of the light is low as viewed through the slit in the spectroscope.
-
•The colors of the peaks observed with the Ocean Optics spectrophotometer (see reference materials at the start of the lab). If there are a lot of bands in one region, it is okay to write "lots of peaks in the red region".
-
•For the hydrogen lamp only, record the wavelength of all lines between 400 and 700 nm in the H lamp with the Ocean Optics spectrophotometer. Assign colors as well. Move the cable in and out to make sure you see the less intense peaks as well.
-
1.What is the typical width of a peak in the gas-discharge lamps spectra?
-
2.In light of the spectra you've observed, could you distinguish between different elements based on their spectral profiles? Why or why not?
-
3.Each transition corresponds to a different electron transition. How many transitions in the visible region did you see in H? Did you see the same number of lines with your eye through the handheld spectroscope as with the Ocean Optics spectrophotometer?
-
4.Which color of light seen corresponded to photons with the longest wavelength, and which with the shortest wavelength? You can identify the peaks by color. Explain your answer.
-
5.According to Max Planck, the energy of a photon of light is inversely proportional to the wavelength of the light. Using your answer from 4 and this relationship, which peak corresponds to photons with the largest value of energy, and which to photons with the smallest value of energy?
-
6.Refer to this figure for this question. Reproduce the figure in your notebook if needed, but please do not draw on this figure. There are four peaks of light seen in the visible region for hydrogen, which correspond to four different electron transitions from the n = 3 to the n = 2 level, the n = 4 to the n = 2 level, the n = 5 to the n = 2 level, and the n = 6 to the n = 2 level.
-
a.The shortest wavelength peak is at the edge of the visible region, and it's not a very intense transition, so it can be a difficult peak to see with the eye. The Ocean Optics spectrophotometer is more sensitive, so you might have seen this transition with that instrument.
-
b.Which of the transitions described above corresponds to the red line seen? Explain your answer, and assign the remaining three transitions to the other lines in the visible region of the H spectrum.
-
Part E: Analysis of Spectral Profiles
Once you've been to every station and completed the observations and answered the questions, get together with another pair of students to discuss the following questions.-
1.Besides differences in color, how did the light emitted from the gas-discharge lamps and the LEDs differ from the light emitted from the incandescent light bulb? Consider the number of peaks seen, the widths of the peaks seen, and any other differences noted.
-
a.Arrange these light sources in order of increasing width of peak, from narrowest peak to widest peak.
-
-
2.The spectral profile of light emitted from the incandescent light bulb is called a continuous emission spectrum, while the spectral profile of light emitted from the gas-discharge lamps is called a line emission spectrum. Do you think these names make sense? Explain your answer.
-
3.Do you think the spectral profile of the LED source is continuous or a line emission spectrum? Explain your answer.
-
4.How do the spectral profiles of the everyday sources of fluorescent light and incandescent light observed in Station A compare to that of the gas-discharge lamps observed in Station C?
-
5.So, how does matter emit light? You've seen three types of spectral profiles—continuous, line, and a combination of the two. What do you think?