
Simple Pendulum
Introduction
Simple Pendulum
A simple pendulum consists of a large mass (bob) suspended by a light string from a rigid support (Figure 1). The length of the string is large compared to the dimensions of the bob. A stationary pendulum has its string in a vertical position with the bob hanging straight down. This is known as the pendulum's equilibrium position (since if left undisturbed, the pendulum will remain in this position). Oscillations (to and fro motion) are set up in a pendulum by displacing the bob from its equilibrium positions and releasing it.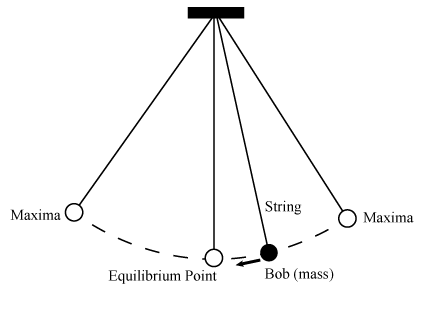
Figure 1: Simple pendulum
Measurements, Mean and Standard Deviation
Due to inaccuracy in measuring any physical quantity, different measurements of the same quantity do not necessarily yield identical results. Having obtained n measurements T1, T2, ..., Tn for a quantity T, the results are often presented in the form where is the arithmetic mean or average of the measurements and is the standard deviation of the set of measurement results. (See the Appendix.) ΔT gives a measure of how much the measurements were spread out. If ΔT is large, the measured values were quite different from each other. Sometimes ΔT is called the random uncertainty of T. The "real value" of T has a 68% probability of being within ΔT of Tmean. In this experiment we will measure the period of the simple pendulum using a stopwatch. Two different approaches for making the measurement will be used. We will also measure the period for a pendulum with a bob of a different mass to explore the dependence of the period on the mass of the bob. For each set of measurements we will determine the average period and the standard deviation.

Objective
This experiment explores the treatment of measurement error and tests if the period of a simple pendulum depends on the mass of the bob. This experiment also serves as an introduction to WebAssign.Apparatus
- Stopwatch
- One pendulum with a heavy mass and one with a light mass (one setup at the front of the room)
Procedure
Please print the worksheet for this lab. You will need this sheet to record your data.
Experiment A
1
The instructor will set the pendulum with the lighter mass in motion and one person from each lab group will time one period. Make sure your stopwatch is at zero and wait until the pendulum has moved at least two cycles before starting the stopwatch. This ensures that the pendulum has had enough time to settle into steady motion. Use the equilibrium position as the reference point for determining the beginning and ending of the cycle. The instructor will ask for the result from each group and will write the data from each group on the whiteboard at the front of the room. Input the measurements of the time for one period done by each group into Table 1 on your worksheet. If there are 12 lab groups present, the table should have 12 entries.
2
What is the number of entries (the number n of measured values) in Table 1?
3
Calculate the average value of the period. (It is suggested that you use Excel to do this and subsequent calculations.)
4
Calculate the standard deviation.
Experiment B
1
Pass the stopwatch to the other member of your lab group. Repeat Experiment A with the same pendulum but now take one of the maximum positions of the bob as the reference point. Input the measurement of the time for one period from each group into Table 2 on your worksheet.
2
What is the number of entries (the number n of measured values) in Table 2?
3
Calculate the average value of the period.
4
Calculate the standard deviation.
Experiment C
1
The stopwatch should be passed back to the first lab partner. Repeat Experiment B, but now with the pendulum that has the heavier mass. As in Experiment B, use one of the maximum positions of the bob as the reference point. Input the measurement of the time for one period from each group into Table 3 on your worksheet.
2
What is the number of entries (the number n of measured values) in Table 3?
3
Calculate the average value of the period.
4
Calculate the standard deviation.
Analysis
Discuss the following questions with your lab partner.1
Do your values of TB, mean or TC, mean agree to within ΔTB and ΔTC? Do your results therefore support or disprove the hypothesis that the period of a simple pendulum is independent of the mass of the bob?
2
Does one choice of reference point give a smaller ΔT than the other choice?