
Lab 9 - Determination of Allura Red Concentration in Mouthwash
Goal and Overview
The spectral profile of Allura Red, or red dye #40, will be measured using a Spec 20 spectrometer. From the spectral profile, the wavelength of light of maximum absorbance,λmax, will be determined. Using the absorbance values obtained for a series of volumetric dilutions made from a stock solution of known Allura Red concentration, a Beer's law plot of absorbance versus concentration will be constructed. The Beer's law plot will be used to determine the concentration of Allura Red in a sample of commercial mouthwash.Objectives and Science Skills
-
•Explain dilution and how it relates to moles of solute in a solution and how it changes the molarity of a solution.
-
•Perform both standard and serial volumetric dilutions and calculate associated molarities.
-
•Understand and explain absorption spectroscopy and the mathematical relationships between percent transmittance, absorbance, concentration, path length, and extinction coefficient.
-
•Apply linear fitting methods to find relationships between dependent and independent variables, such as percent transmittance (absorbance) and concentration; explain and apply Beer's Law.
-
•Use absorption data to qualitatively and quantitatively analyze the concentration of Allura red in solution.
Suggested Review and External Reading
-
•reference material on spectroscopy and dilution; textbook information on spectroscopy
Background
The study of the interaction of light with matter is called spectroscopy. Spectroscopy can be used for both qualitative and quantitative analysis of matter. Recall that visible photons correspond to a very small part of the electromagnetic spectrum between 400 (violet) and 700 (red) nanometers (1 nm = 10–9 m). This lab uses absorption of visible light to measure the amount of a molecule present in solution. Absorption and emission strictly follow the law of conservation of energy. The photon's energy is transferred directly to or from the molecule: Ephoton = ΔEmolecule. The absorption or emission of a photon of the appropriate energy can cause transitions between electronic and vibrational energy levels of a molecule. Molecular absorption and emission spectra are called band spectra because they appear as broad peaks ("bands").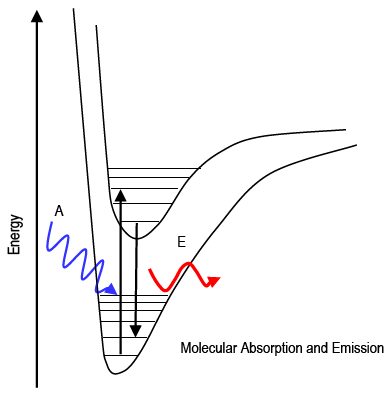
Figure 1
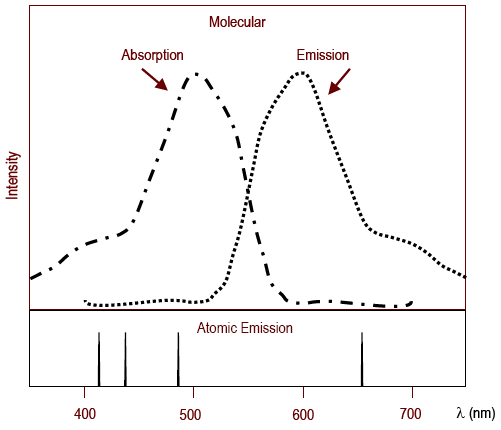
Figure 2
-
ithe light comes from the emitting source directly; or,
-
iithe photons have been reflected or transmitted from some molecules.
-
• Violet: 400 - 420 nm • Indigo: 420 - 440 nm • Blue: 440 - 490 nm • Green: 490 - 570 nm • Yellow: 570 - 585 nm • Orange: 585 - 620 nm • Red: 620 - 700 nm
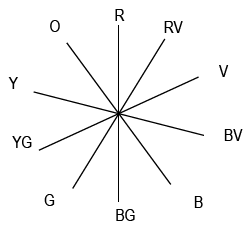
Figure 3
-
ito scan over a range of wavelengths to identify which wavelength is most strongly absorbed by the molecule of interest (λmax);
-
iito quantify the concentration of absorbing molecules in the sample by measuring how many photons are absorbed at λmax (Beer's Law).
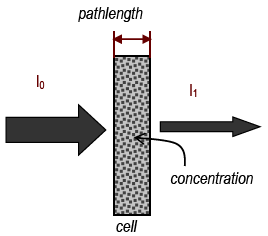
Figure 4
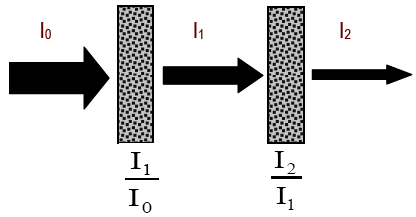
Figure 5
( 1a )
T1 =
=
= T2
| I1 |
| I0 |
| I2 |
| I1 |
( 1b )
Ttotal =
=
·
=
| I2 |
| I0 |
| I1 |
| I0 |
| I2 |
| I1 |
 |
| I1 |
| I0 |
 | 2 |
( 2 )
Ttotal =
=
·  ·
·
=
=
T1 cm
| Ib |
| I0 |
| I1 |
| I0 |
· | Ib |
| Ib − 1 |
|
| I1 cm |
| I0 |
| b |
 |
 | b |
( 3 )
Ttotal =
=
=
T1 M
| Iconc |
| I0 |
|
| I1 M |
| I0 |
| c |
|
| c |
( 4 )
Ttotal =
T1 M, 1 cm
=
|
| bc |
|
| I1 M, 1 cm |
| I0 |
| bc |
( 5 )
T =
=
10−ε
= 10−εbc
|
| I1 cm, 1 M |
| I0 |
| bc |
|
| bc |
( 6 )
A = −log
= −log
10−εbc
= εbc
|
| %T |
| 100% |
|
|
|
Use of the Spec 20 Spectrometer
In a spectrometer, light from a source passes through a number of components before going through the sample and onto a detector. A bulb emits white light, which contains all wavelengths. The light passes through a monochromator, which is a device (usually a prism or a grating) that spreads out the different colors and lets only one get through. By adjusting the monochromator, the wavelength can be selected. This single wavelength is then passed through the sample. The light then strikes a detector, which is a photocell whose electrical output is proportional to the amount of light that strikes it. This output is amplified to drive a meter that shows how much light was absorbed or transmitted.
Source → lenses/slits/collimators → monochromator → sample → detector → computer/measuring device
( 7 )
% Transmittance = %T = %incident light transmitted =
× 100% =
× 100%.
| intensity of light leaving cell |
| intensity of light entering cell |
| I |
| I0 |
A = −log
= −log
10−εbc
= εbc
|
| %T |
| 100% |
|
|
|
A = −log
= −log
10−εbc
= εbc
|
| %T |
| 100% |
|
|
|
Steps for Using Spec 20 to Measure Absorbance
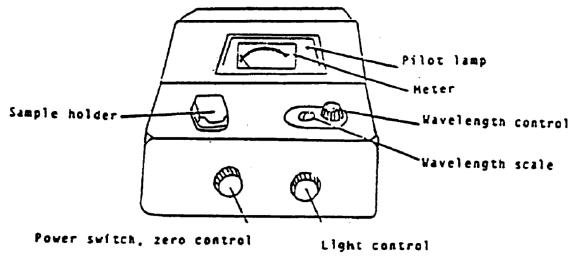
Figure 6
1
If the spec is off, make sure sample holder is empty, close the cover, and turn the spec on. It should warm up 30 minutes. Your instrument should already be warmed up.
2
Be sure that the correct detector is in place (blue sensitive, 350-595 nm, or red-sensitive, 600-950 nm).
3
Set the wavelength that you want.
4
You must blank the spec every time you change the wavelength setting. Adjust to 0% transmittance with sample holder empty
and cover closed (turn zero control knob to give 0%T reading on meter). Adjust to 100% transmittance with the sample holder containing a cuvet 2/3 full of solvent (the "blank"). Line up the mark on the cuvet with the mark on cell holder to insure a constant pathlength for all readings. Close the cover and turn the light control knob to the 100%T reading. If needle flickers or wanders after about 5 sec, report the malfunction. Remove the cuvet and close the cover.
5
Re-check 0%T and 100%T until no further changes are needed.
6
Measure %T of the sample. Fill the other cuvet 2/3 full of the sample. Insert the cuvet and close the cover. Read the %T. Remove the cuvet and close the cover.
-
icollect the spectral profile (absorbance over a range of wavelengths) and plot the data to find λmax; and,
-
iitake absorbance measurements at λmax using solutions of known concentration to create a Beer's Law plot. The slope divided by the cell pathlength (measured in cm) is the experimentally-determined value for ε.
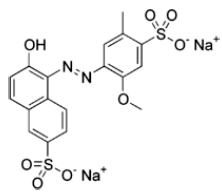
Figure 7
Procedure
Be sure to use the same Spec 20 for the entire experiment.
Part 1: Spectral Profile for Allura Red to Find the Maximum Wavelength
1
Take about 40 mL of the stock solution of Allura Red.
2
Record the concentration of the stock solution.
3
Fill the spectrometer cell about 2/3 full with the stock solution.
4
Record percent transmittance (%T) to 0.1% over the entire visible range (400 - 700 nm).
-
iNear the absorbance maximum (transmittance minimum), use 5 - 10 nm intervals.
-
iiAway from the minimum T range, use 20 nm intervals.
5
Calculate absorbance at each wavelength to three significant figures using Eq. 6A = −log
= −log
10−εbc
= εbc
|
| %T |
| 100% |
|
|
|
6
Create the spectral profile by graphing A vs. λ. This must be included in your results.
7
Determine the value of λmax. Does your value of λmax make sense, given that you are looking at a red dye?
Part 2: Transmittance (and Absorbance) for Known Concentrations of Allura Red
The Beer's law plot requires absorbance data for a range of concentrations. The concentration range needs to include the unknown concentrations you plan to measure (the mouthwash). Four dilutions of a stock solution of Allura Red are needed. During dilution, the number of moles of solute does not change, so the concentration of the dilute solution is given by the dilution equation,M1V1 = M2V2 = nsolute.
Here, each of the four dilutions will be 1/2 the concentration of the one before
it; the process is called "diluting by a factor of two". The volume goes up by a factor of 2, so the concentration goes down to
half of what it was.
To make a volumetric dilution:
-
iTake a known volume (aliquot), V1, of the stock solution of concentration c1. Use a volumetric pipet to deliver the solution into a volumetric flask. Do not use graduated glassware like a graduated cylinder.
-
iiAdd pure solvent until the final total volume is V2. Use a disposable pipet for the last few drops in order to get the bottom of the meniscus to be at the mark on the flask.
-
iiiThe dilution equation works for any consistent concentrations units (here, mol/L), and any consistent volume units (here, mL).
1
Record the concentration of the stock solution of Allura Red. It is approximately 0.002% by mass: gAllura Red/gsolution × 100 %.
Calculate the molarity to two significant figures. Assume the density of the solution is roughly that of water.
2
Use a 25 mL volumetric pipet and a 50 mL volumetric flask.
3
Make a set of four serial dilutions using the procedure outlined above. Dilution 1: take 25 mL of the stock solution;
dilute to 50 mL. Dilution 2: take 25 mL of dilution 1 and dilute to 50 mL. Repeat for dilutions 3 and 4.
The four dilutions and the stock solution are five solutions of known concentration of Allura Red; the sixth should be the
blank (deionized water), where you should have zero absorbance for zero concentration.
4
For each solution, measure the %T at λmax to 0.01% (6 points).
5
Calculate the absorbance for each to three significant figures. Use Eq. 6A = −log
= −log
10−εbc
= εbc
|
| %T |
| 100% |
|
|
|
6
Plot absorbance against concentration (include in results).
7
Draw the best straight line fit to the data points.
8
Determine the slope to the ones place: A = slope × concentration.
Recall A = (εb)c. You should now be able to:
-
ifind absorbance, given concentration; or,
-
iifind concentration, given absorbance.
9
Use your ruler to measure b, the inner diameter (pathlength) of your cuvette to 0.01 cm.
10
Calculate your experimental value of ε, the extinction coefficient, for Allura Red.
An example plot is shown in figure 8. Where εb = 24943.
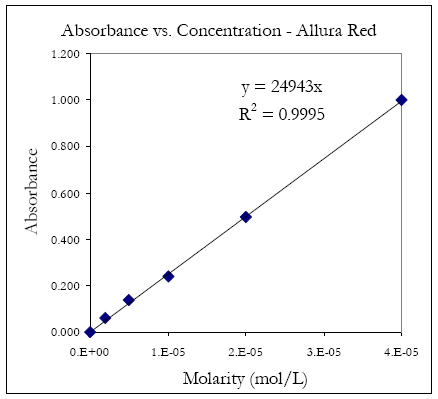
Figure 8
Part 3: Determination of Allura Red (Red Dye #40) Concentration in Mouthwash
The concentration of Allura Red in the commercial mouth wash is too high to read directly, so you will have to dilute it.1
Obtain about 7 mL of the mouthwash. This is enough for three trials.
2
Make a 1 to 25 dilution using a 2 mL volumetric pipet and 50 mL volumetric flask. Repeat this two more times.
3
Measure %T for each diluted sample, and convert to A.
4
Calculate the concentration of dye in each diluted solution to two significant figures using your Beer's Law plot results.
5
Take into account the dilution factor and report the concentrations of Allura Red in the original mouthwash (undiluted) to two significant figures.
6
Determine the average concentration and the standard deviation of the three values obtained from your three trials.
7
Also calculate the average number of Allura Red molecules in one milliliter of mouthwash.
Waste Disposal: Follow your TA's instructions for waste disposal.
Reporting Results
Complete your lab summary or write a report (as instructed).Abstract
Results
-
λmax and ε of Allura Red (include spectral profile plot)
-
%T measurements for known concentrations (include Beer's Law plot)
-
%T of mouthwash (dilutions and undiluted)
-
Average concentration and standard deviation of Allura Red in undiluted mouthwash
Sample Calculations
-
Absorbance from transmittance
-
Dilution
-
Slope and extinction coefficient
-
[Allura Red]cuvette and [Allura Red]mouthwash
- No. of Allura Red molecules in one mL of mouthwash
Discussion/Conclusion
-
What you did, how you did it, and what you determined.
-
Does λmax agree with observed color?
-
How was Beer's law used?
-
What were the final results?