
The Photoelectric Effect and the Quantization of Light
Introduction
When a light with a sufficiently high frequency shines on a metal plate, electrons are ejected from the plate. This effect is known as the photoelectric effect. The electrons ejected in this process are called photoelectrons.
Figure 1
-
•Electrons are ejected only when the frequency of the incident light is higher than a threshold value, fo, regardless of how intense the light is. The threshold frequency depends on the material being illuminated.
-
•Electrons are emitted from the surface almost instantaneously, even at low light intensities.
-
•When a photoelectric effect is observed, the number of electrons ejected is proportional to the intensity of the incident light. However, the maximum kinetic energy (KEMAX) of the photoelectrons is independent of the light intensity.
-
•The maximum kinetic energy of the photoelectrons increases with higher frequency light.
( 1 )
E = hf
( 2 )
h = 6.6260755 × 10⁻³⁴ J · s( 3 )
hfo = ϕ( 4 )
KEMAX = hf – ϕApparatus

Figure 2

Figure 3
eV = KEMAX,
even the most energetic electrons (with maximum KE) will be attracted back to the anode and hence, V will have reached a maximum. This maximum value of V is called the stopping potential. Thus, if we can measure this potential and substitute eV for KEMAX
in Eq. (3)hfo = ϕ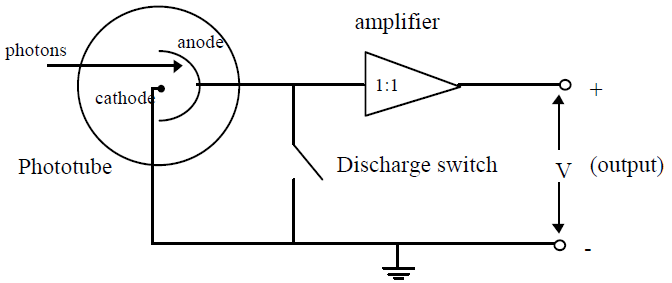
Figure 4
( 5 )
eV = hf - ϕ( 6 )
V =
f −
 |
| h |
| e |
 |
| ϕ |
| e |
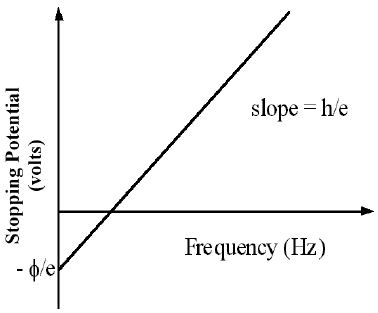
Figure 5
VOUT/VIN = 1
)
amplifier lets you measure the stopping potential with a digital voltmeter. While the impedance (i.e.
resistance) of the amplifier is very high, it is not infinite and some charge leaks off. Thus charging
the apparatus is analogous to filling a bathtub with different water flow rates while the drain is partly
open.
Procedure
Part 1: Apparatus Set Up
The apparatus should be mostly assembled when you arrive. You may, however, need to check focus and alignment and adjust these as needed. See Fig. 2 for overall assembly view.-
1Before checking the following adjustments, place the hinged bars at about a ninety-degree angle so that you have clearance to work. Note that one light source serves two photoheads, so do not move the light source without consulting with the other students sharing your lamp.
-
2The Lens/Grating Assembly mounts on the support bars of the Light Aperture Assembly. The grating is blazed (marked), to produce the brightest spectrum on one side. During your experiment the Lens/Grating Assembly may need to be turned around in order to have the brightest spectrum on a convenient side of your lab table. Consult with your lab instructor if this seems to be the case.
-
3If the Light Source is not on, turn it on.
Do not turn off the lamp unless told to do so by
your instructor.
- (The lamp is expensive and its lifetime is shortened more by being turned off and on than by running continually.) Check the alignment of the Light Source and the Aperture to ensure that the light illuminates the Lens/Grating assembly.
-
4The amplifier in the h/e Apparatus is powered by two 9-volt batteries. You should check the output voltage of the batteries before using the apparatus. Battery test points are located on the side panel of the Apparatus near the ON/OFF switch (see Fig. 6). Batteries functioning below the recommend minimum operating level of 6 volts may cause erroneous results in your experiments. To check the batteries, use a voltmeter and measure the potential difference between the OUTPUT GROUND TERMINAL and each BATTERY TEST TERMINAL. If either battery tests below its minimum rating of +6V or –6V, ask your instructor to replace it before you start taking data.
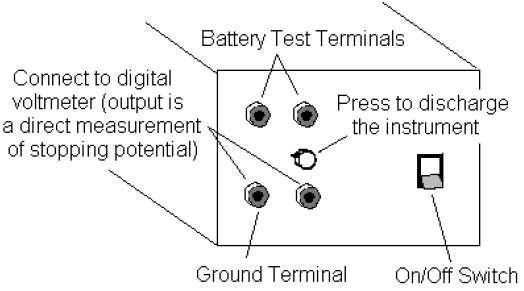
Figure 4
-
5Rotate the h/e Apparatus about the pin of the Coupling Bar Assembly until one of the colored maxima in the first order shines directly on the slot in the white reflective mask.
It is important
that light of only one color enters the slot. There must be no overlap from adjacent spectral
maxima.
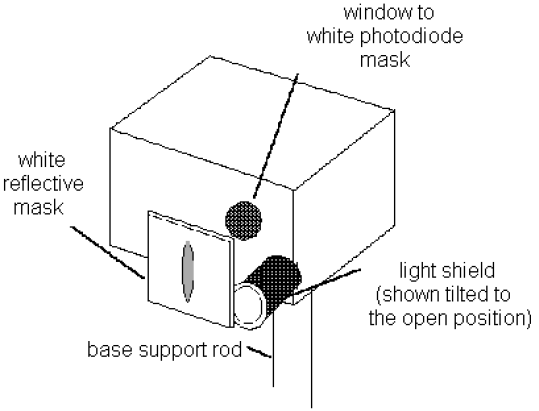
Figure 7
-
6See Fig. 7. Rotate the light shield of the h/e Apparatus out of the way to reveal the white photodiode mask inside the Apparatus. Rotate the h/e Apparatus back and forth on the base support rod until the image of the aperture is centered on the window in the phototube mask. (If the light will not fall on the window, you may not have the entire assembly directly in front of the mercury lamp.) Then tighten the thumbscrew on the base support rod to hold the Apparatus in place.
-
7Slide the Lens/Grating Assembly back and forth on its support rods, until you achieve the sharpest possible image of the aperture on the window in the phototube mask. The Assembly will probably end up very near to the end of the rod. Tighten the thumbscrew on the Lens/Grating Assembly and replace the light shield to prevent stray light from striking the phototube.
-
8Connect the digital voltmeter (DVM) to the OUTPUT TERMINALS of the h/e Apparatus (see Fig. 6). Select the 2V or 20V DC range on the meter.
-
9Turn ON the power switch on the h/e apparatus. The output potential difference displayed on your digital voltmeter is a direct measurement of the stopping potential for the photoelectrons.
Part 2: Intensity Dependence
According to the quantum model of light, the maximum kinetic energy,KEMAX
, of photoelectrons depends only on the frequency of the incident light, and is independent of the
intensity. Thus, the higher the frequency of the light, the greater its energy. In contrast, the classical
wave model of light predicted that KEMAX
would depend on light intensity. In other words, the
brighter the light, the greater its energy. In this part of the experiment, you will investigate the
intensity dependence of the photoelectric effect. You will select two spectral lines from the mercury
light source and investigate the maximum energy of the photoelectrons as a function of the intensity.
-
1Adjust the h/e Apparatus so that only one of the spectral colors falls upon the opening of the mask of the phototube. If you select the green or yellow spectral line, place the corresponding colored filter over the white reflective mask on the h/e Apparatus.
-
2Place the Relative Transmission Filter in front of the white reflective mask (and over the colored filter, if one is used) so that the light passes through the section marked 100%. Press the INSTRUMENT DISCHARGE BUTTON (see Fig. 6), release it, and record the DVM potential difference once the instrument has reached a maximum potential difference. The charging time may take several seconds. Record the approximate charging time.
The electrodes of the phototube should be discharged before each measurement by using the discharge button, otherwise the potential difference reading may be inaccurate.
-
3Repeat Step 2 until you have tested the sections of the filter marked 100%, 80%, 60%, 40% and 20%.
Note: a small drop (a few percent or less) in potential difference with decreasing light intensity is most likely due to charge leaking off the high impedance amplifier in the h/e Apparatus. The charging time should increase with decreasing intensity, but do not be concerned if this is not the case since the charge leaking from the amplifier may alter the results.
-
4Repeat the procedure for a different color from the spectrum.
Part 3: Stopping Potential Dependence on Frequency
In this part of the experiment you will measure the stopping potential for different frequencies of light incident on the phototube.-
1You can see five colors in three orders of the mercury light spectrum. Adjust the h/e Apparatus carefully so that only one color falls on the openings of the mask of the phototube.
-
2For each color in the first order, record the stopping potential measured with the DVM. Use the yellow and green colored filters on the Reflective Mask of the h/e Apparatus when you measure the yellow and green spectral lines.
-
3Move to the second order and repeat the process.
-
4Move the power switch on the h/e Apparatus to the OFF position, but leave the mercury light source ON unless yours is the last lab section of the day (check with your TA to confirm).
Analysis
-
1Make a scatter plot of V vs. f from the data collected in Part 3.
-
2If the plot forms a straight line, use the linear least square fit to determine the slope and the intercept of the line.
-
3Calculate the work function in units of electron volts (eV) from the intercept and determine its uncertainty.
-
4Calculate the threshold frequency, fo.
Discussion
Part 2: Intensity Dependence
Summarize your experimental results for the intensity dependence of the stopping potential. Describe the effect that passing different amounts of the same colored light through the Variable Transmission Filter has on the stopping potential, and thus, the maximum energy of the photoelectrons. Defend whether this experiment supports a wave or a quantum model of light based on your lab results.Part 3: Stopping Potential Dependence on Frequency
Summarize your experimental results for the Planck's constant, the work function and the threshold frequency. Compare your value of h to the accepted value of 6.626 × 10⁻³⁴ J · s. Discuss possible systematic errors and how they might affect your results.
Be sure that both you and your TA each initial your data, and that you hand in a copy of your data before leaving the lab. Remember to pledge your work.