Stem-and-Leaf Plots
A stem-and-leaf plot presents all individual values and is an excellent tool for sorting data, and with a sufficient sample size, it can be used to judge shape. Somewhere between about 6 and 15 stems (intervals) is usually suitable for judging shape. The shape of a dataset is usually described as either symmetric, meaning that it is similar on both sides of the center, or skewed, meaning that the values are more spread out on one side of the center than on the other. If it is skewed to the right, the higher values (toward the right on a number line) are more spread out than the lower values. If it is skewed to the left, the lower values (toward the left on a number line) are more spread out than the higher values.
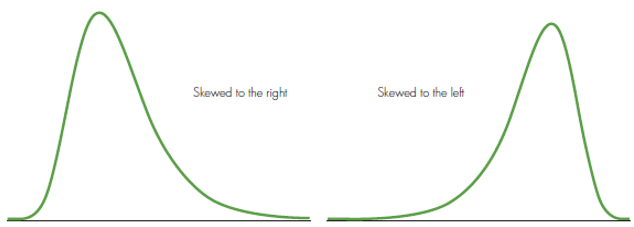
The figure below illustrates the distinction between the two different directions of skewness.
There are two graphs.
- The first graph is labeled "Skewed to the right." The curve enters the window from the left, at a height of nearly zero above the horizontal axis, goes up and to the right, changes direction before the midway point of the horizontal axis, and then goes down and to the right before exiting the window at a height of nearly zero above the horizontal axis.
- The second graph is labeled "Skewed to the left." The curve enters the window from the left, at a height of nearly zero above the horizontal axis, goes up and to the right, changes direction after the midway point of the horizontal axis, and then goes down and to the right before exiting the window at a height of nearly zero above the horizontal axis.
A row in the plot starts with a "stem" and each stem gives the first part of a data value. A value within a row is called a "leaf" and it gives information about the last part of a data value. There will be more than one way to define equally spaced stems. For example, consider data ranging from 34 to 97. We could have stem values representing the decades (3, 4, …, 9) for a total of seven stems, or we could allow two stem values for each decade, for a total of 14 stem values. With two stems for each decade, the first instance of each stem value would receive leaves of 0 to 4, and the second would receive leaves of 5 to 9. So two observations in the 30s, for example 34 and 36, could be represented in two different ways: