
Lab 4 - DC Circuits and Ohm's Law
Introduction
During the nineteenth century so many advances were made in understanding the electrical nature of matter that it has been called the "age of electricity." One such advance was made by a German physicist named Georg Simon Ohm. Ohm was interested in examining the relative conductivity of metals and in investigating the relationship between the electromotive force (potential difference) and the current in a conductor. By taking wires made from different materials but having the same thickness, passing a current through these wires, and measuring the electromotive force, i.e., the potential difference between the ends of the conducting wire, he was able to determine experimentally the relative conductivity of certain metals such as silver, copper, and gold. In another experiment using a piece of apparatus that he built, Ohm investigated the effect of current in a conductor on the voltage drop across the conductor. He found that for a given conductor the voltage drop was directly proportional to the current in the wire. When voltage is plotted against the current in a given conductor, the data can be fitted to a straight line, the slope of which is the resistance of the conductor. This result was published in 1826. In recognition of Ohm's work, this empirical relationship bears his name.Discussion of Principles
Ohm's Law can be written algebraically asΔV = RI, where ΔV,
measured in volts, represents the potential drop or potential difference across the conductor, I is the current in the conductor measured in amperes, and R is the resistance of the conductor measured in units called "ohms" symbolized by Ω, upper-case Greek omega. Note: Some textbooks use V rather than Δ\!V
for potential difference.
Resistance and Resistors
Resistance is a property of materials. Resistors are conducting devices made from materials, which satisfy Ohm's Law. If the potential difference across a resistor is set at 1 volt, and if a current of 1 amp is measured in the conductor, then its resistance is determined to be 1 ohm, or 1 Ω. Instead of using thin wires as Ohm did in his original experiment, you will replicate his results using small cylindrical ceramic resistors.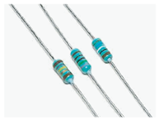
Figure 1: Color-coded ceramic resistors
Combinations of Resistors
Resistors can be combined in simple circuit arrangements that increase or decrease the overall resistance in the circuit. These arrangements are called series and parallel circuits. Figure 2a illustrates two resistors connected in series and Fig. 2b shows the resistors in a parallel arrangement.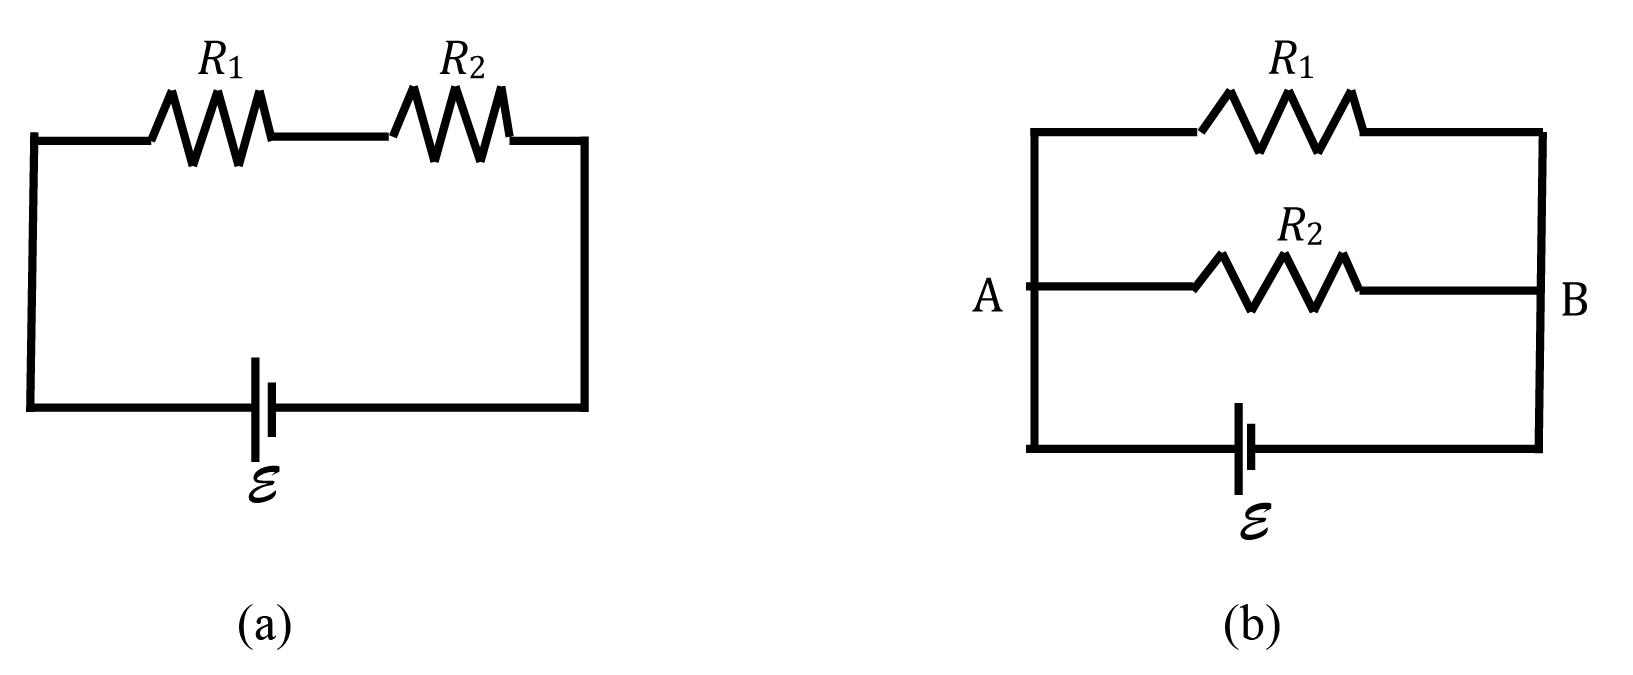
Figure 2: Resistors in Series and Parallel Arrangements
 in
in Fig. 2).
In the series arrangement shown in Fig. 2a the current I in the circuit goes through each resistor. If we compute the potential drop ΔV1
across R1 using Ohm's Law, it is ΔV1 = IR1.
Likewise, the drop across R2 is ΔV2 = IR2.
The potential drop across both resistors is ΔV = ΔV1 + ΔV2
which is equal to . One can think of the applied voltage being divided between the two series resistors R1 and R2.
In the parallel arrangement shown in Fig. 2b, the current divides at the junction A and recombines at junction B. Therefore, the current through R1 and R2 will be different. Notice that in this case ΔV = ΔV1 = ΔV2.
That is, the potential drop across each resistor is the same.
Using algebra the relationships for determining equivalent resistance Req for resistors in series and/or parallel can be derived.
( 1 )
Series Req = R1 + R2 + . . .
( 2 )
Parallel
=
+
+ . . .
| 1 |
| Req |
| 1 |
| R1 |
| 1 |
| R2 |
Measuring Current and Voltage
Ammeters are used to measure the current flowing in a circuit. To do so, the ammeter should be connected in series with the circuit element through which you want to measure the current. Introducing an ammeter into a circuit should not affect the flow of current in the circuit and therefore ammeters have very low resistance. Voltmeters are used to measure the potential difference or voltage drop across a circuit element. To do this, the voltmeter should be connected to the two points across which you want to measure the potential difference. In other words, the voltmeter should be connected parallel to the circuit element. Voltmeters should not affect the current flowing through the circuit element and therefore voltmeters have high resistance. This prevents current from flowing through them.Reading the resistor code
The resistance of most ceramic resistors can be determined from the colored bands printed on the resistor. Each color represents a digit from 0 to 9.| black | 0 | green | 5 | |
| brown | 1 | blue | 6 | |
| red | 2 | violet | 7 | |
| orange | 3 | gray | 8 | |
| yellow | 4 | white | 9 |
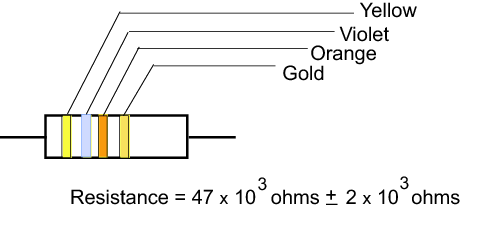
Figure 3: Reading the color code
Objective
The objective of this experiment is to use Ohm's Law to determine the resistance of several individual resistors and the equivalent resistance of series and parallel combinations. You will apply various voltages across the resistor (or circuit) using a power supply, and measure the current I through the resistor and the voltageΔV
across the resistor for each setting of the power supply. From a plot of ΔV
vs. I, you will determine the resistance. You will compare the measured value of the resistance with the manufacturer's value.
Equipment
- Pasco circuit board with two unknown resistors
- DC power supply — adjustable from 0 to 5 V
- Two hand-held multimeters
- Connecting wires
Procedure

Procedure A: Determining Resistor Value Using Color Code
1
Enter the color of the four bands for the two resistors in Data Table 1.
2
Determine the resistor value and corresponding tolerance for the resistors and enter these values in Data Table 1. You will use these values as the expected or manufacturer's values when comparing with the experimental values.
Checkpoint 1:
Ask your TA to check your reading of the color code.
Ask your TA to check your reading of the color code.
Procedure B: Determining R1
To determine the resistance, you will set up the following circuit.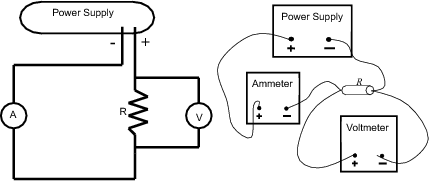
Figure 4: Circuit diagram for Procedure A
 represents a multimeter as an ammeter and
  represents a multimeter as a voltmeter.
You will use the circuit board shown in Fig. 5 below. The connection points are numbered in the schematic of the circuit board shown in Fig. 5b. Refer to these numbers as you make the connections for each part of the lab.
represents a multimeter as a voltmeter.
You will use the circuit board shown in Fig. 5 below. The connection points are numbered in the schematic of the circuit board shown in Fig. 5b. Refer to these numbers as you make the connections for each part of the lab.
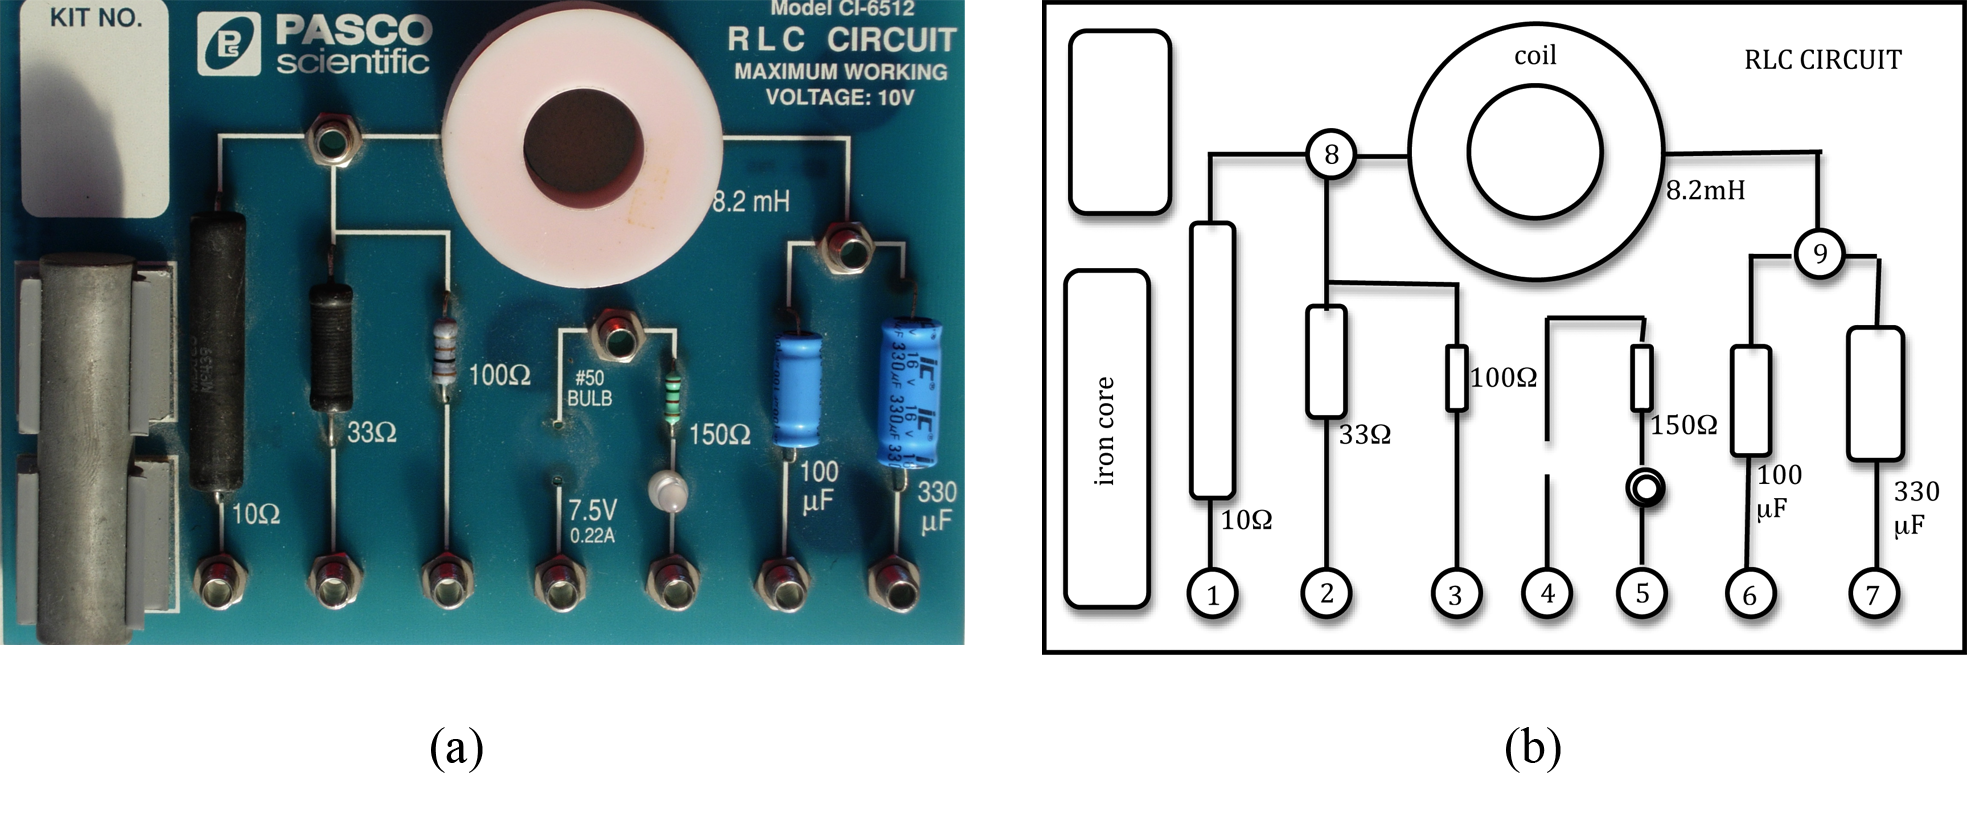
Figure 5: Photo and schematic of circuit board
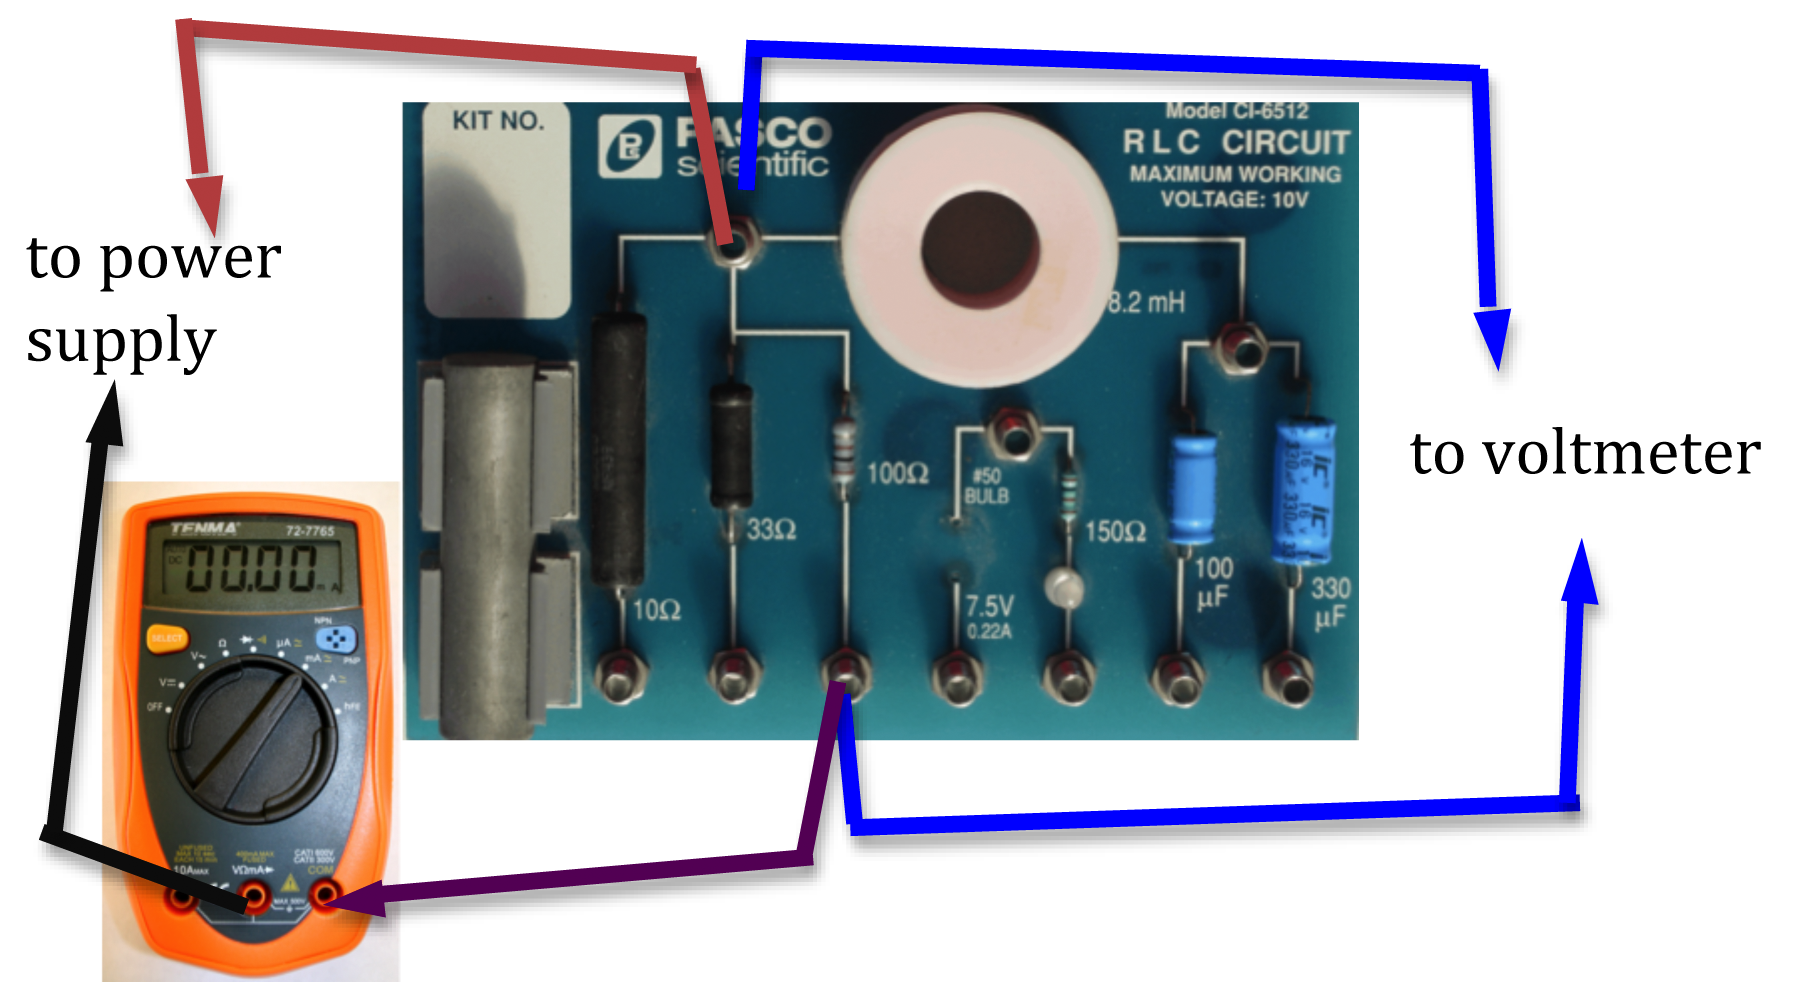
Figure 6: Circuit diagram for 100 Ω resistor
3
Make sure the power supply is turned off.
4
Connect the circuit shown in Fig. 6 for the 100 Ω resistor.
Precaution: If the multimeters are not set to the proper scale, it can damage the meters. Before you turn the power supply on, your TA must check your circuit.
Checkpoint 2:
Ask your TA to check your circuit and multimeter settings.
Ask your TA to check your circuit and multimeter settings.
5
Set the power supply to deliver 3 V. Record the ammeter and voltmeter readings on your worksheet. Record the actual voltmeter reading and not the value on the power supply as these two readings might be slightly different.
6
Increase the power supply output in steps of 1 volt and record the ammeter and voltmeter readings on your worksheet, for a total of five different voltmeter readings.
7
Construct a graph of ΔV
versus I using Excel and include error bars for ΔV.
Assume a 5% tolerance for the voltmeter reading. See Appendix G.
8
Use the Linest function in Excel to determine the resistance and its uncertainty from the slope of the graph. See Appendix J.
9
Compute the percent error between the manufacturer's value of the resistance (from Data Table 1)
and the experimental value. See Appendix B.
Checkpoint 3:
Ask your TA to check your chart, calculations, and Excel graph before proceeding.
Ask your TA to check your chart, calculations, and Excel graph before proceeding.
Procedure C: Determining R2
10
Disconnect the first resistor and connect the second resistor as shown in Fig. 7.

Figure 7: Circuit diagram for 33 Ω resistor
11
Repeat steps 5-9 with this second resistor and complete Data Table 3 on the worksheet.
12
Compute the percent error between the manufacturer's value of the resistance (from Data Table 1)
and the experimental value.
Checkpoint 4:
Ask your TA to check your chart, calculations, and Excel graph before proceeding.
Ask your TA to check your chart, calculations, and Excel graph before proceeding.
Procedure D: Determining Equivalent Resistance—Series Arrangement
13
Connect the two resistors you used before in a series arrangement. Connect one multimeter in series with the two resistors to read the current flowing in the circuit. See Fig. 8.
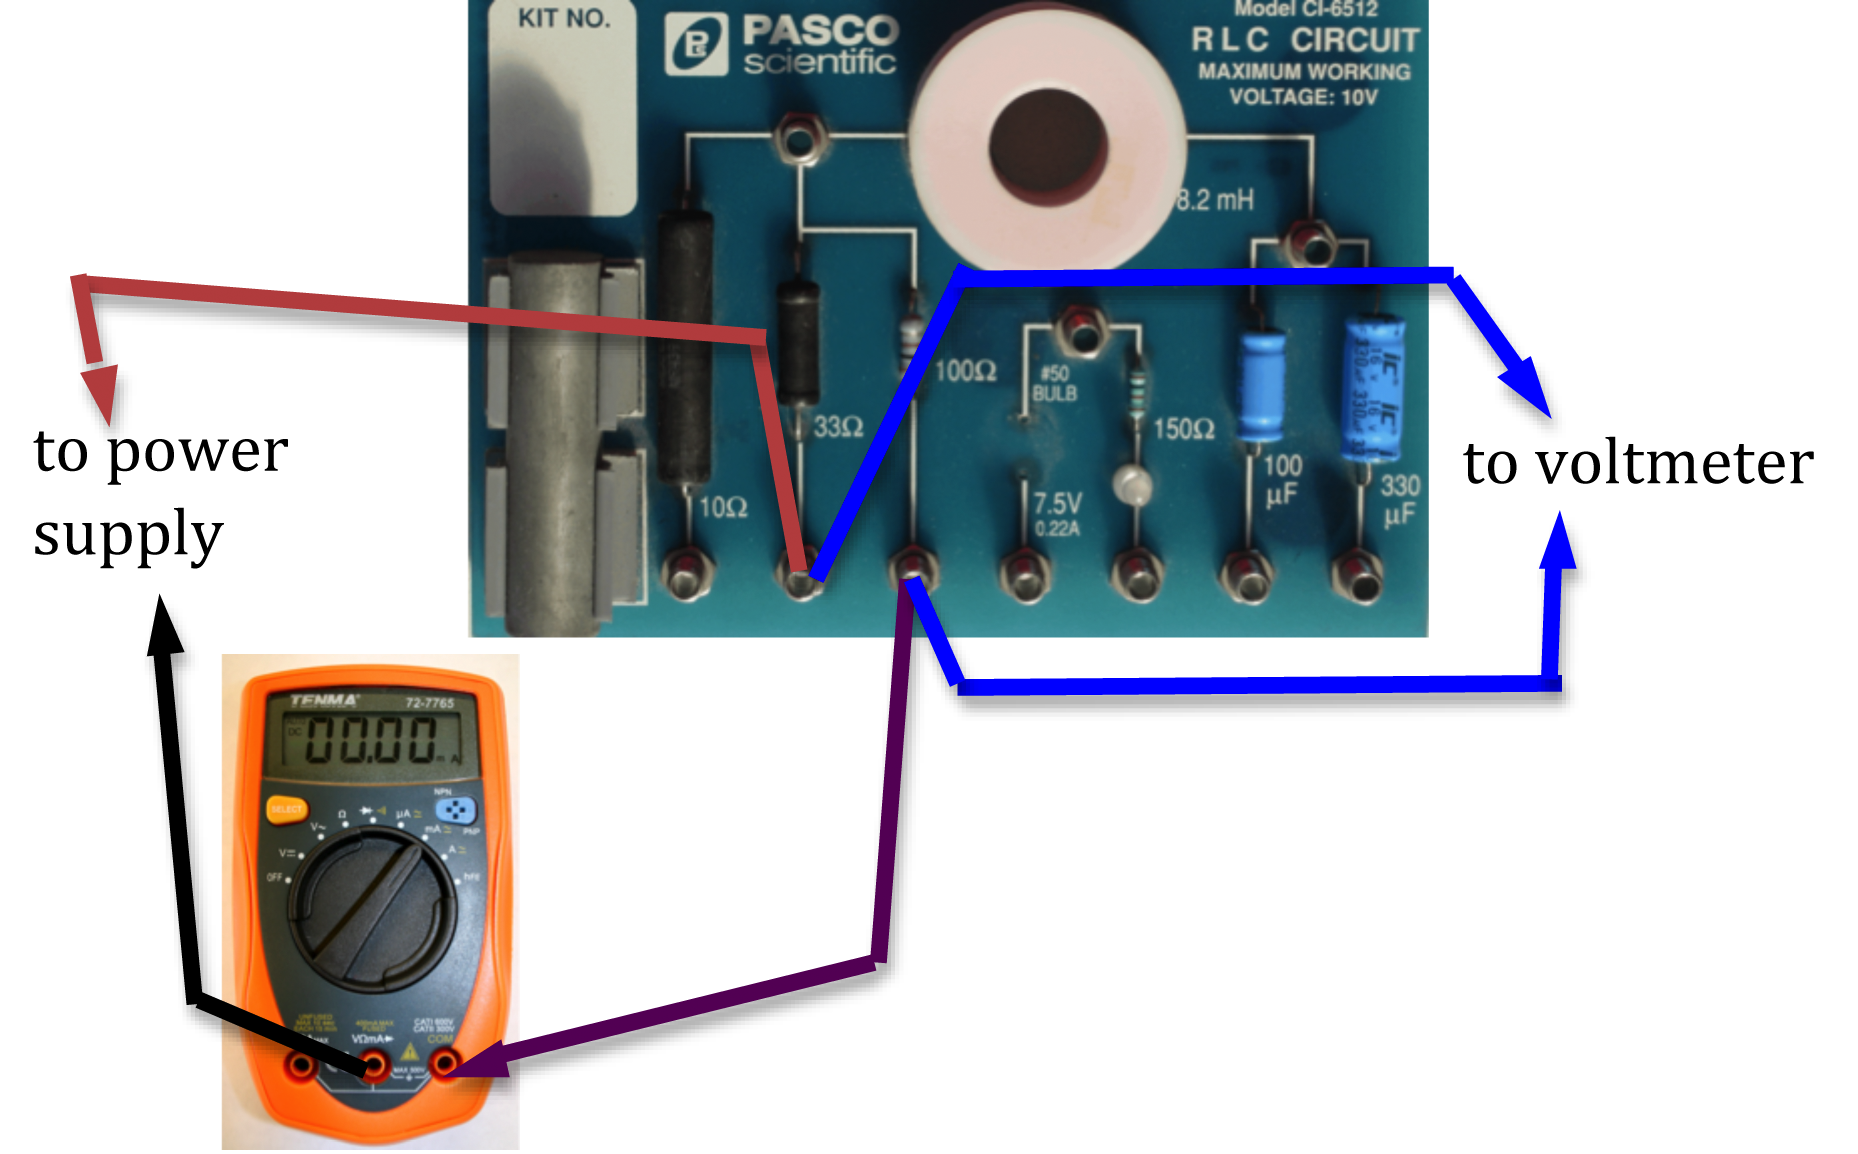
Figure 8: Connections for series circuit
You will use the other multimeter as a voltmeter for measuring the potential difference across the series combination (as shown in Fig. 8), and then across each individual resistor R1 and R2. See Figs. 9 and 10 below.
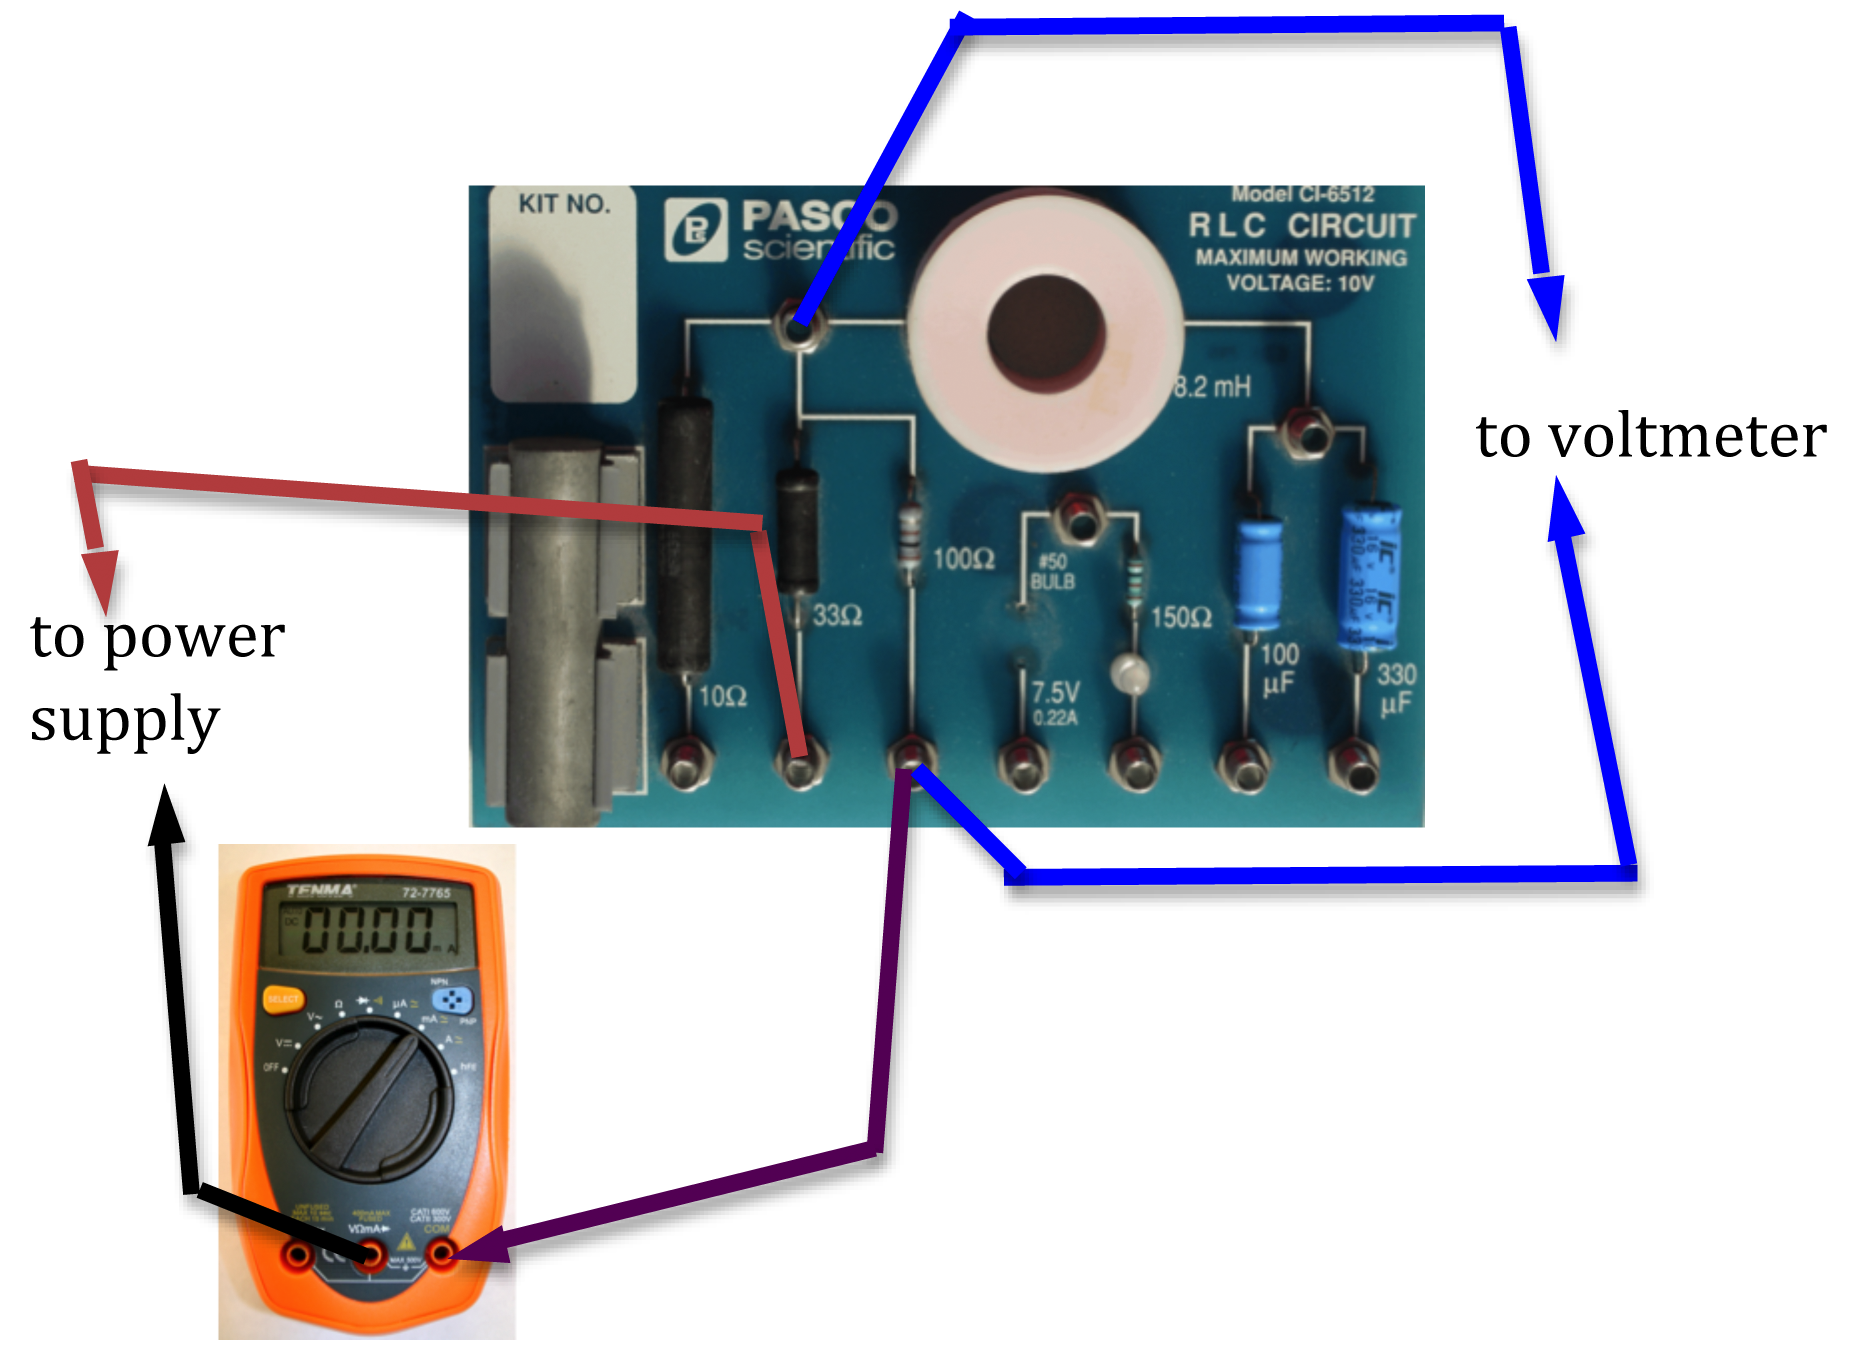
Figure 9: Measuring potential difference across the 100 Ω resistor
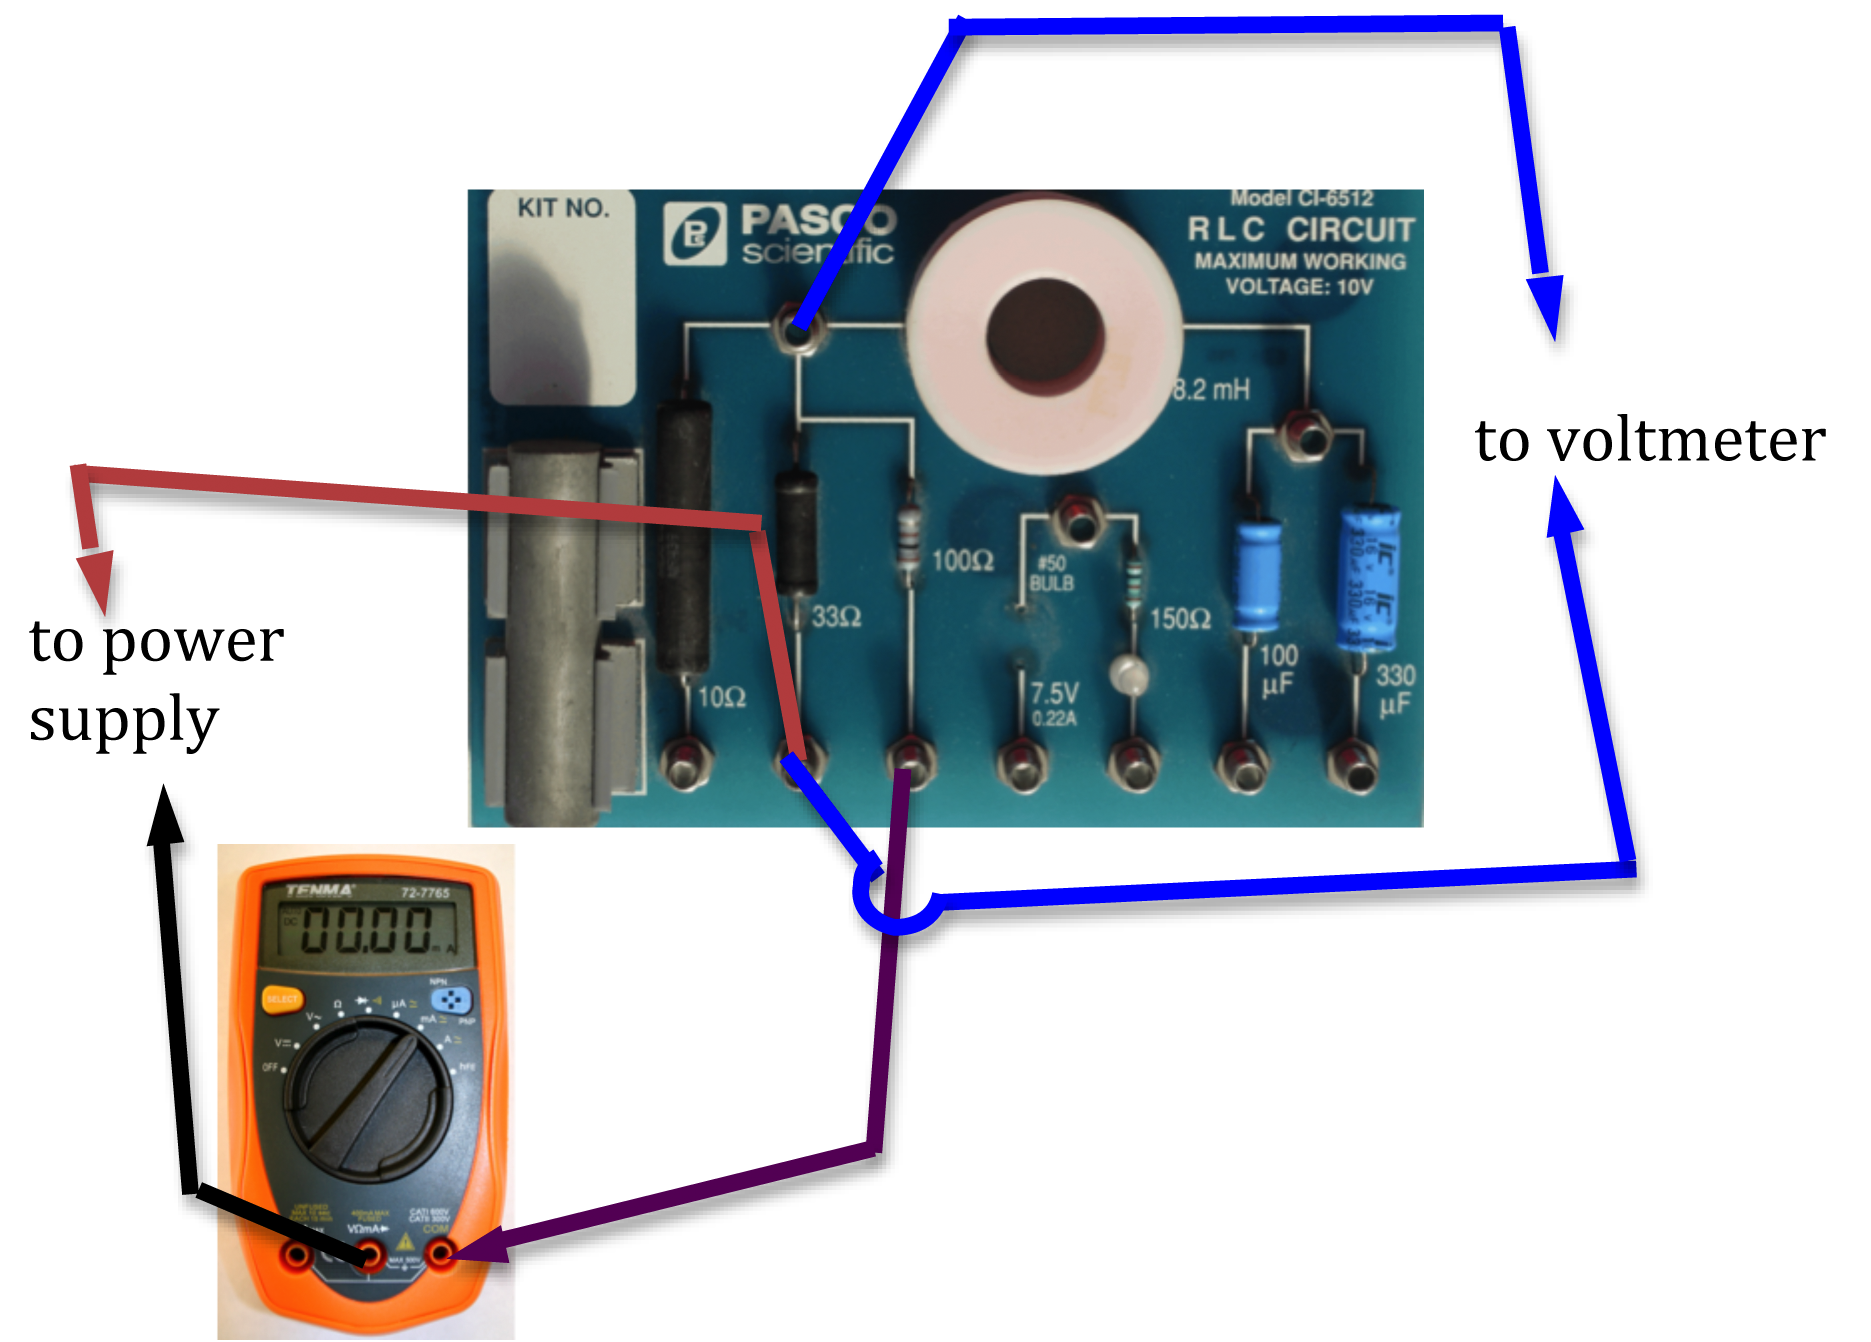
Figure 10: Measuring potential difference across the 33 Ω resistor
Checkpoint 5:
Ask your TA to check your circuit before proceeding.
Ask your TA to check your circuit before proceeding.
14
Set the power supply to deliver 3 V. Record the voltmeter reading across the combination and the ammeter reading in the first two columns in Data Table 4 on the worksheet.
15
Measure ΔV1
and ΔV2,
the potential drops across R1 and R2 respectively. Enter these in columns 3 and 4 in Data Table 4 on the worksheet.
16
Repeat steps 14 and 15 for four more readings of the power supply.
17
Use the first two columns of Data Table 4 to draw a graph using Excel and determine the equivalent resistance and corresponding uncertainty of the series combination from the slope of the graph.
18
Compute the theoretical equivalent resistance of the series combination using Eq. 1 and the values from Data Table 1. Also calculate the uncertainty in this value.
19
Compute the percent error between the measured and calculated values of the equivalent resistance. Record this on the worksheet.
20
Use the data in columns 3 and 4 of Data Table 4 to determine the total voltage across the series combination. Enter these values in the same data table.
21
Compare the measured and calculated total voltage drop across the series combination by computing the percent difference between the two values. Record these in Data Table 4.
Checkpoint 6:
Ask your TA to check your chart, calculations, and Excel graph before proceeding.
Ask your TA to check your chart, calculations, and Excel graph before proceeding.
Procedure E: Determining Equivalent Resistance—Parallel Arrangement
22
Connect the two resistors you used before in a parallel arrangement. Connect the voltmeter to measure the potential difference across the parallel combination. See Fig.11 below.
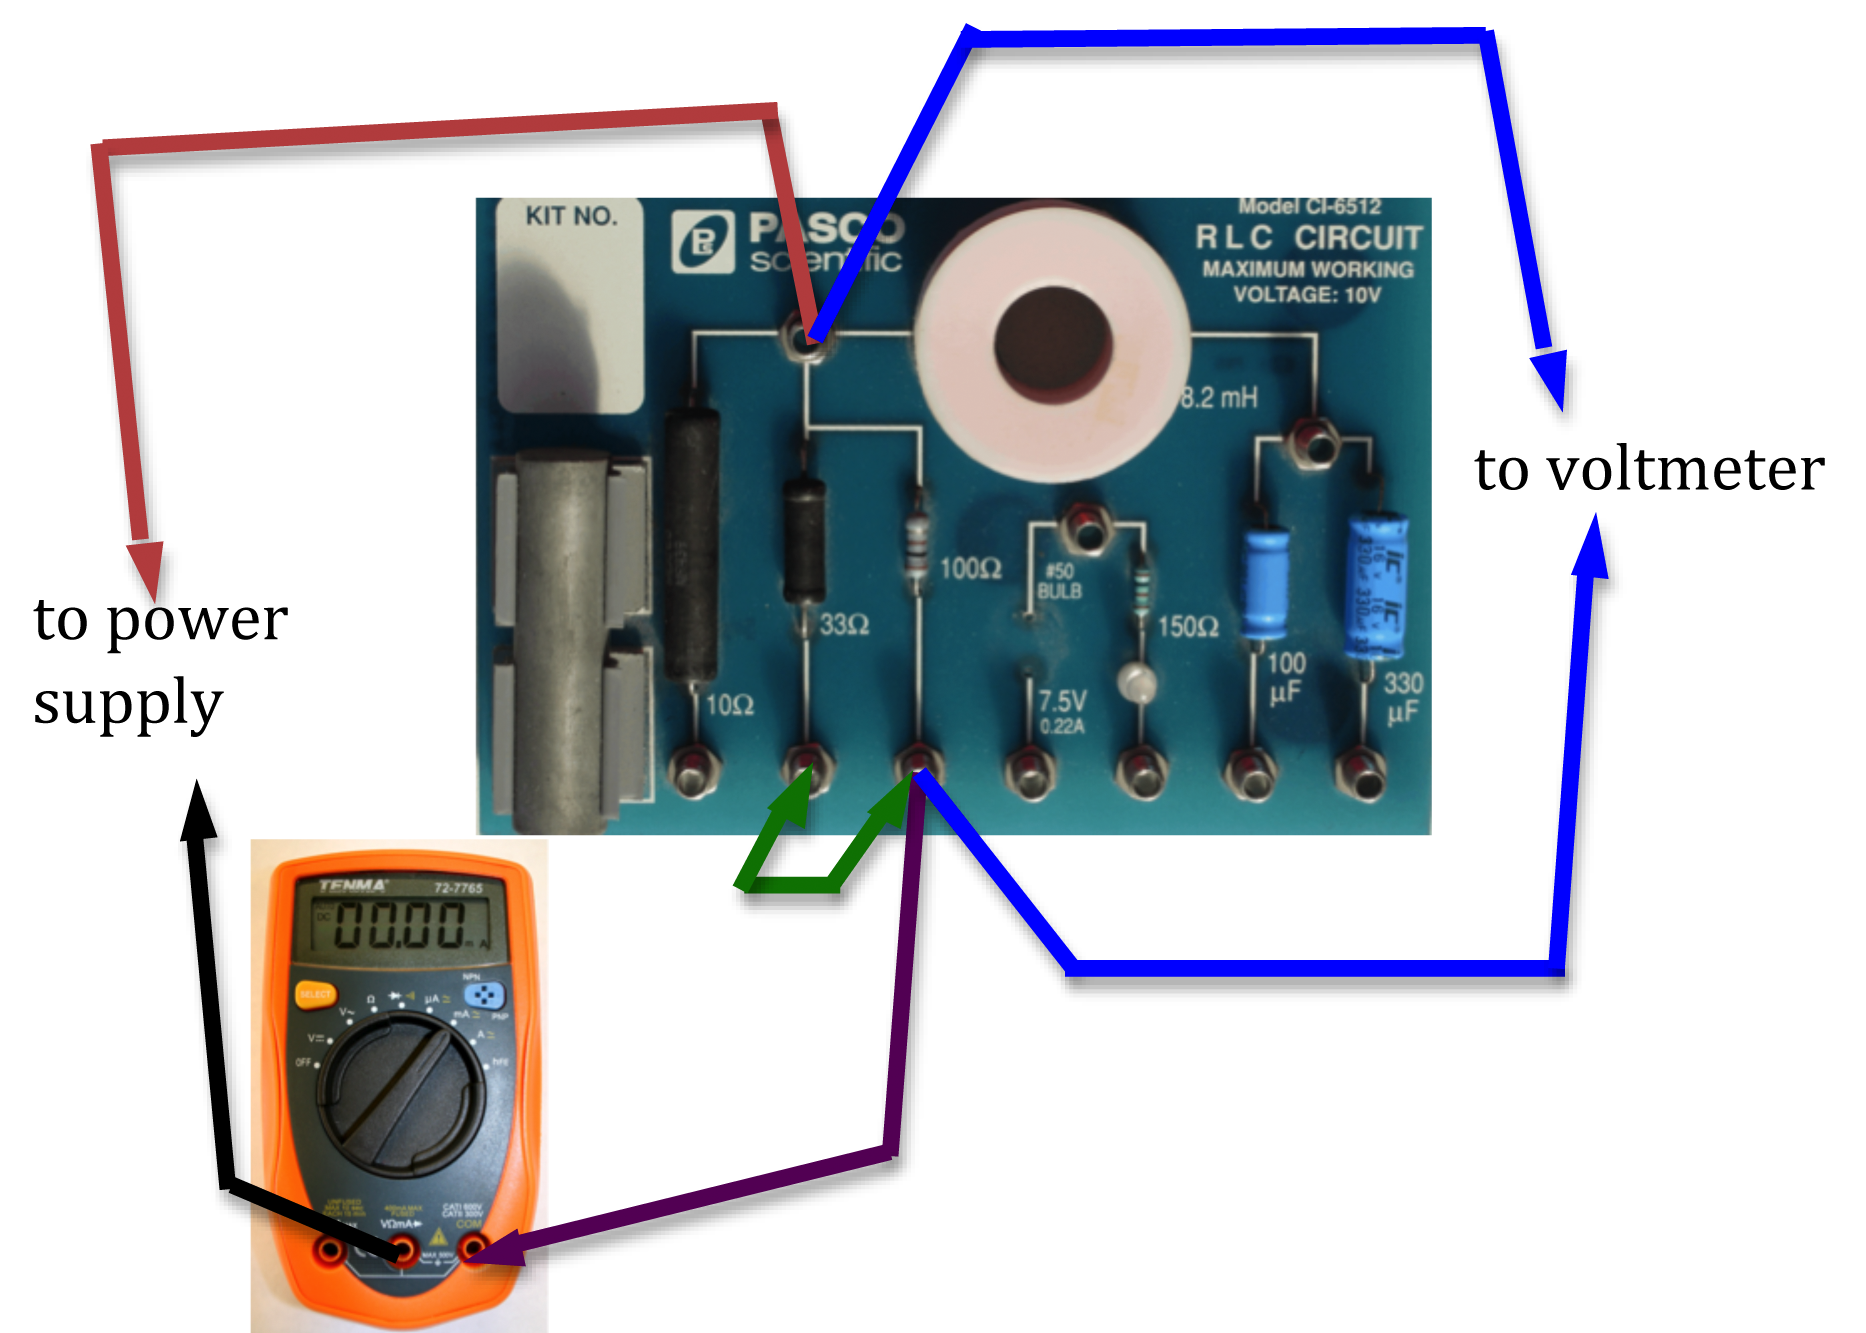
Figure 11: Connection for parallel circuit
You will use the second multimeter as an ammeter to measure the current I flowing out of the power supply, as well as I1 and I2, the currents flowing through R1 and R2, respectively. To do this you will first connect the ammeter in series with the power supply (as in Fig. 11) to measure I. You will then disconnect the ammeter and connect it, first in series with R1 (see Fig. 12) and then in series with R2 (see Fig. 13) to measure I1 and I2.
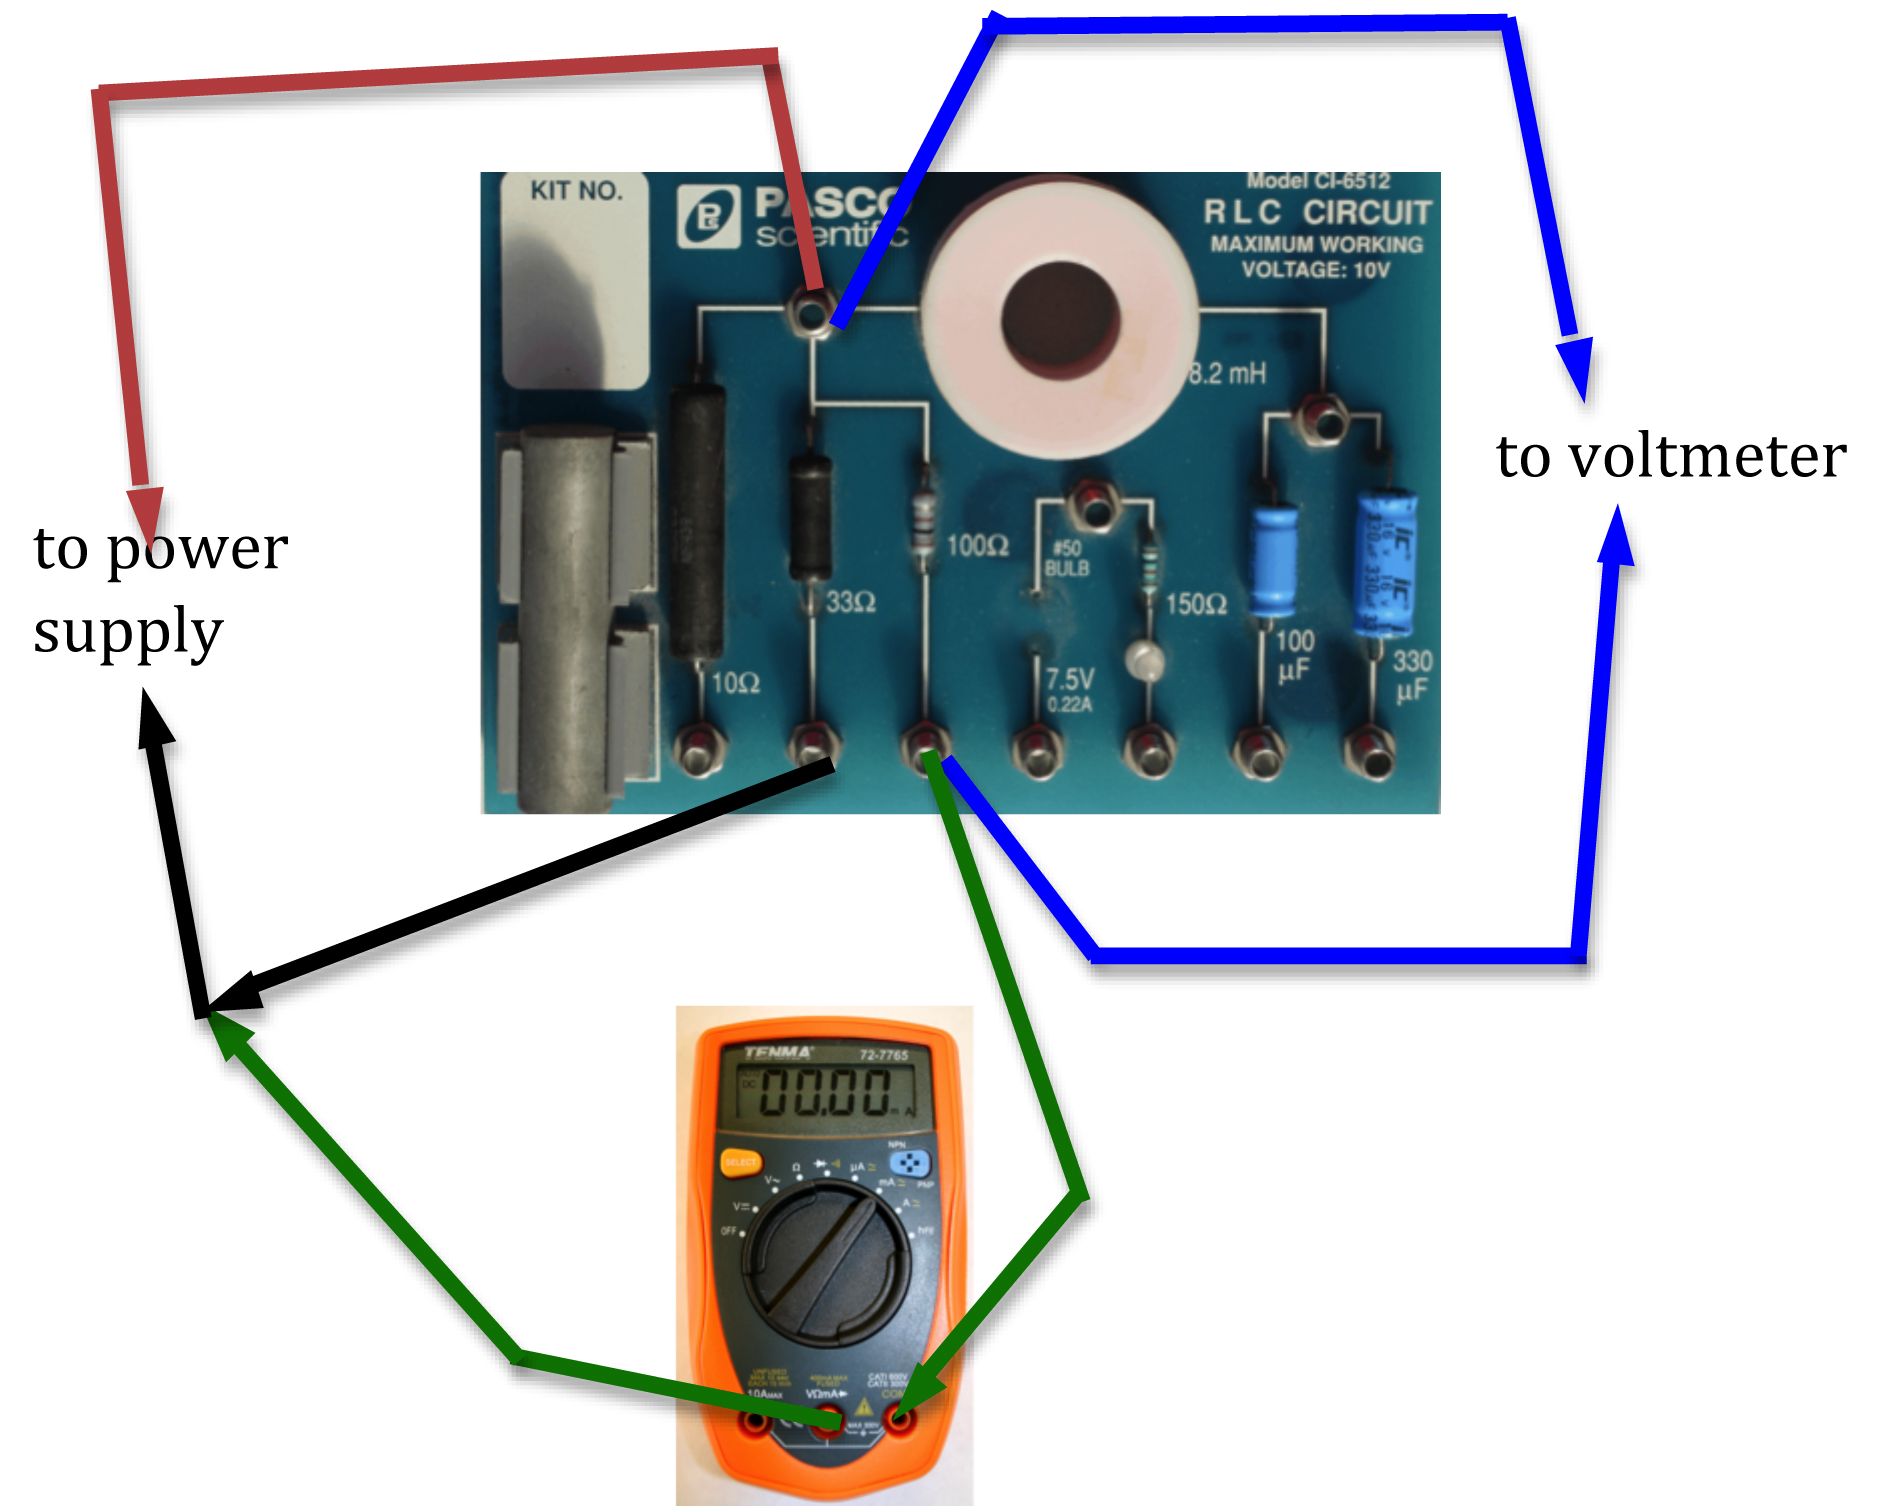
Figure 12: Measuring current through 100 Ω resistor
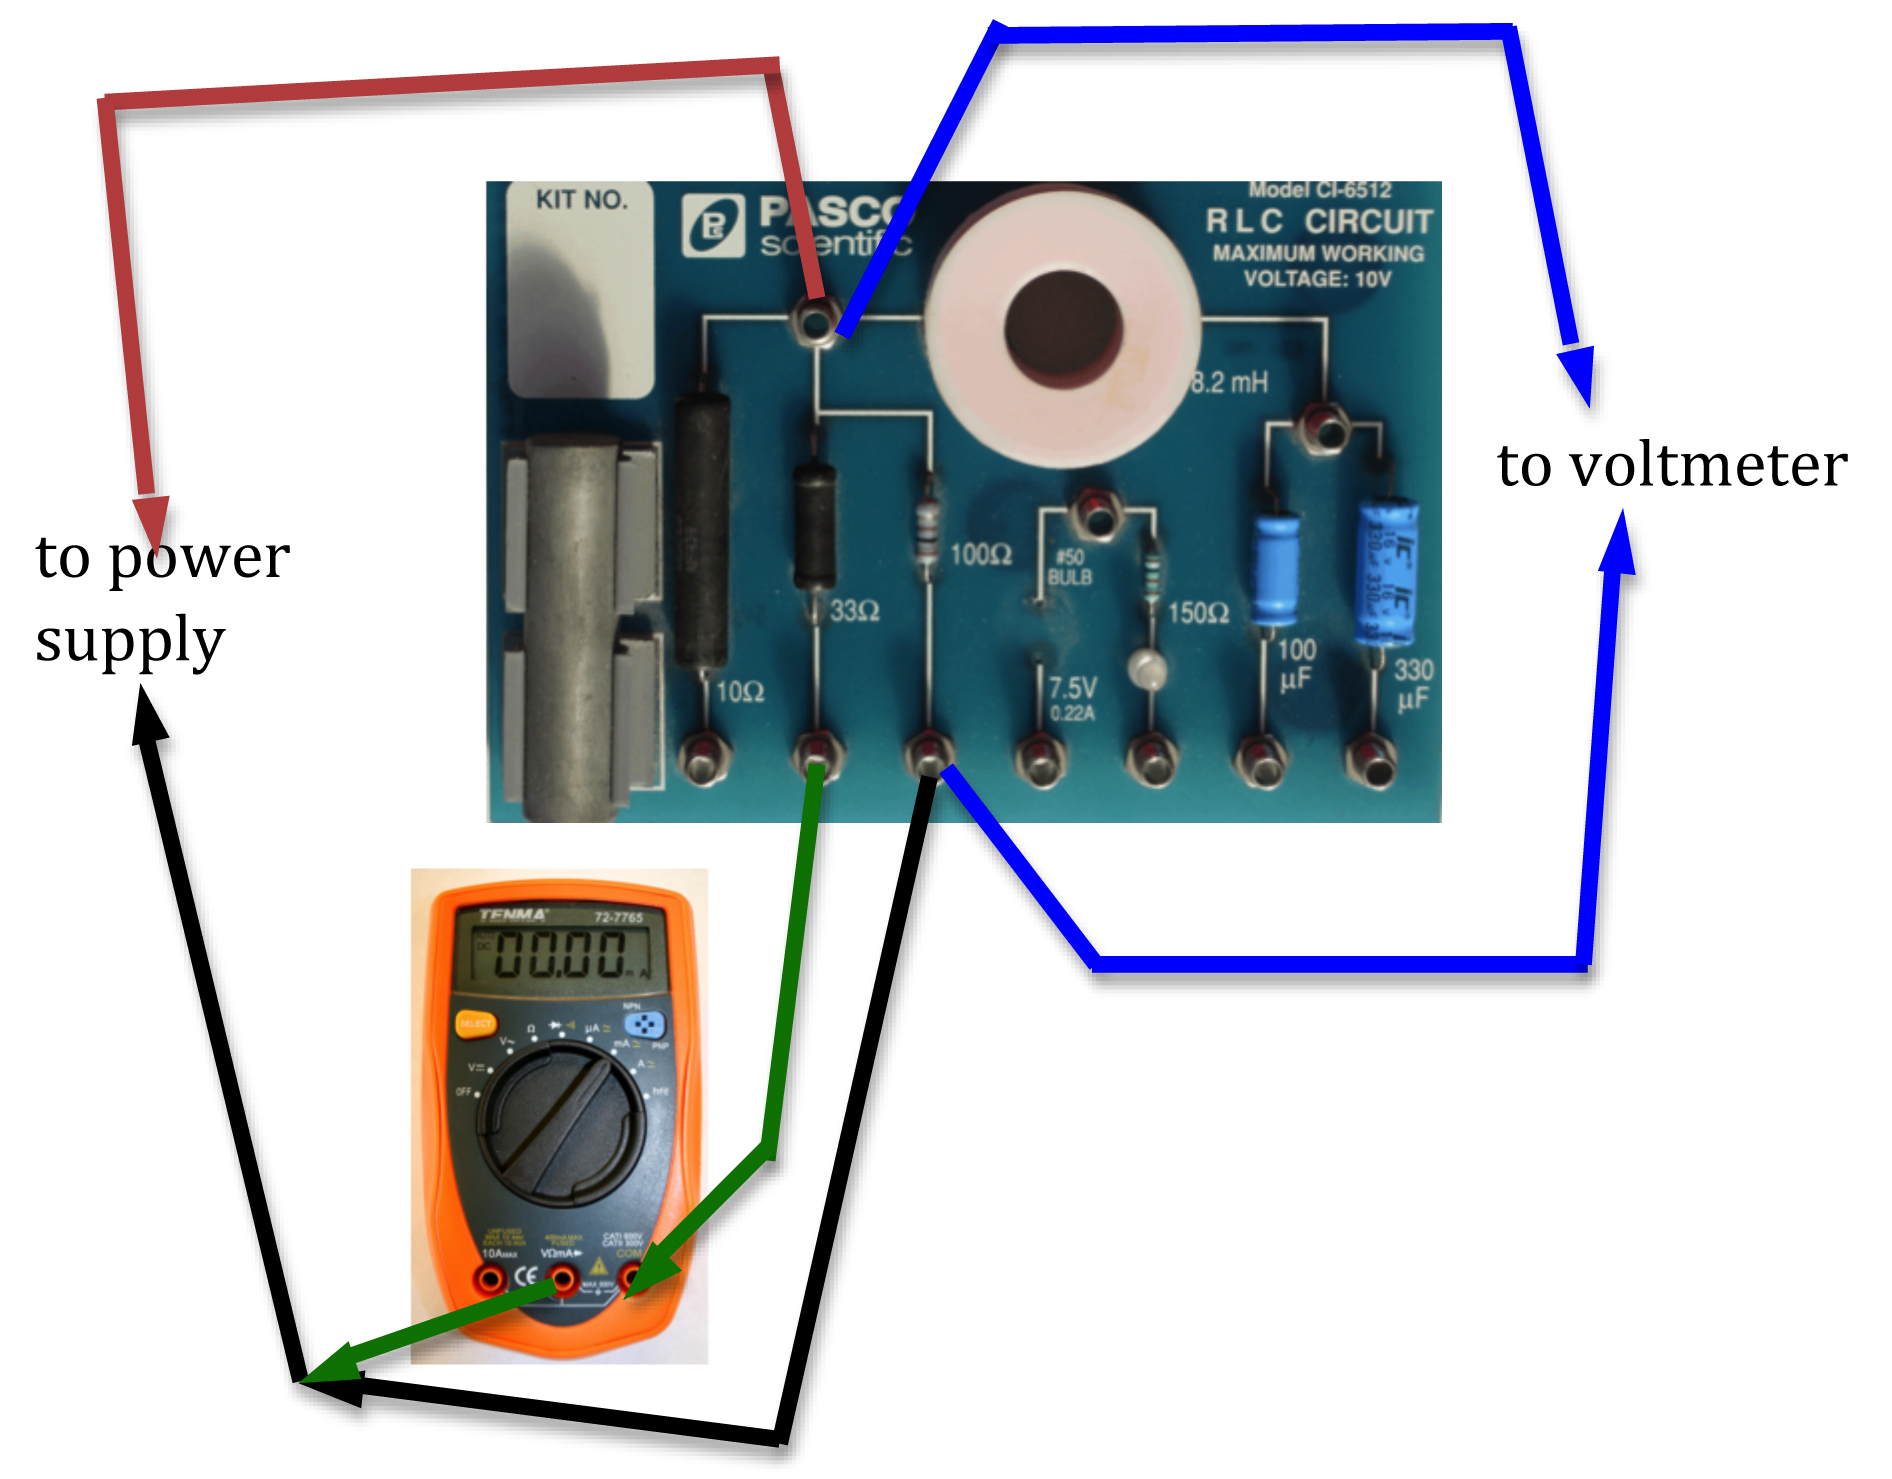
Figure 13: Measuring current through 33 Ω resistor
Checkpoint 7:
Ask your TA to check your circuit before proceeding.
Ask your TA to check your circuit before proceeding.
23
Set the power supply to deliver 3 V. Record the voltmeter reading in the first column in Data Table 5 on the worksheet.
24
Measure I, I1, and I2, the currents flowing from the power supply, and through R1 and R2 respectively. Enter these in columns 2, 3, and 4 in Data Table 5 on the worksheet.
Checkpoint 8:
Ask your TA to check your chart, calculations, and Excel graph before proceeding.
Ask your TA to check your chart, calculations, and Excel graph before proceeding.
25
Repeat steps 23 and 24 for four more readings of the power supply.
26
Use the first two columns of Data Table 5 to draw a graph.
Then use the Linest function in Excel to determine the equivalent resistance and corresponding uncertainy of the parallel combination from the slope of the graph.
27
Compute the theoretical equivalent resistance of the parallel combination using Eq. 2 and the values from Data Table 1. Also calculate the uncertainty in this value.
28
Compute the percent error between the measured and calculated values of the equivalent resistance. Record this on the worksheet.
29
Use the data in columns 3 and 4 of Data Table 5 to determine the total current flowing through combination. Enter these values in the same data table.
30
Compare the measured and calculated total current in the circuit by computing the percent difference between the two values. Record these in Data Table 5.