Graph a Function with a Single Asymptote with WAPlot

Graph a function with a single asymptote using Mathematica® syntax.
graph of y = 1/(x + 5) with vertical asymptote -5

This type of Mathematica graph is primarily used to plot lines, curves, and basic functions with or without asymptotes.
  1. Click Questions > Create.
    The Question Editor opens.
  2. In Name, type a name for the question.
  3. In Mode, select one of the question modes to define the basic behaviors for your question.
  4. In Question, type your question.

    Use the answer placeholder string <_> to specify where the answer box should be displayed.

  5. In Answer, specify the answer key for your question. Often, you will specify distractors or options configuring your question's behavior.
  6. Add WAPlot tags to the question, answer, or solution field of a question.
    If a WAPlot image is used in the answer field, the question mode must be multiple-choice, and there cannot be linebreaks in the WAPlot code. WAPlot images cannot be placed in assignment descriptions.
    <waplot type='MathematicaSyntax'> </waplot>
  7. Insert the Mathematica code for your function inside the WAPlot tags.
    waplot type='MathematicaSyntax'>
        Plot[
            1/(x + 5), 
            {x, -11,11}, 
            Exclusions->{x==-5},
            ExclusionsStyle->Directive[Black, Dashed],
            PlotRange->{{-10,10}, {-10,10}},
            AxesLabel->{x, y},
            AspectRatio->Automatic,
            PlotStyle->Directive[Red, Thick]    
        ]
    </waplot>
    Do not include "y =" before your expression. All expressions are assumed to be of the form "y =" and adding this will cause the solution to your function to be displayed as the y-axis label.
    To show an asymptote without marking it on the graph, give the exclusion as a value instead of an equation.
    Exclusions->{-5}
  8. In the <waplot> tag, use the @alt attribute to add alternative text describing the image for students using screen readers.
    alt='graph of y = 1/(x + 5) with vertical asymptote -5'
    Make sure the content of the alternative text is appropriate to the pedagogy of your question.

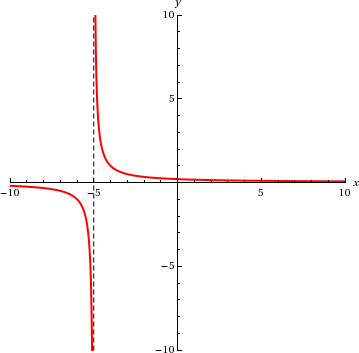
Graphing a Function with an Asymptote

The following table summarizes an actual question.

QID

3969556

Name

Template2 6.WAPLOT.03.

Mode

Numerical

Question

At what <em>x</em>-value does the graph have a vertical asymptote?
<figure>
    <waplot type='MathematicaSyntax' alt='graph of y = 1/(x + 5) with vertical asymptote -5'>
        Plot[
            1/(x + 5), 
            {x, -11,11}, 
            Exclusions->{x==-5},
            ExclusionsStyle->Directive[Black, Dashed],
            PlotRange->{{-10,10}, {-10,10}},
            AxesLabel->{x, y},
            AspectRatio->Automatic,
            PlotStyle->Directive[Red, Thick]    
        ]
    </waplot>
</figure>
<em>x</em> = <_>

Answer

-5 {tab} 0

Display to Students

Question as displayed to students

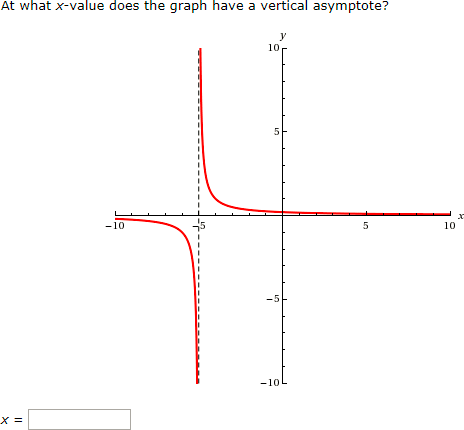
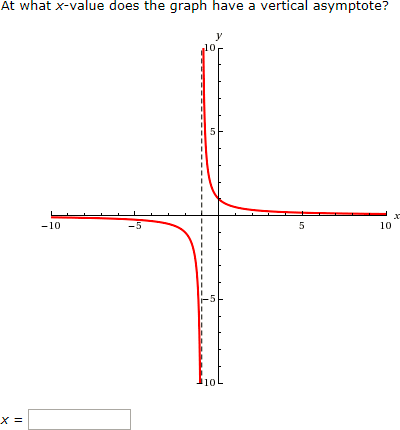
Graphing a Randomized Function with an Asymptote using Mathematica

The following table summarizes an actual question.

QID

3979294

Name

Template2 6.WAPLOT.04.

Mode

Numerical

Question

<eqn>
# (-$va) is the value of the vertical asymptote
$va = randnum(1,7,1);
 ''</eqn>

At what <em>x</em>-value does the graph have a vertical asymptote?
<div class='figure'>
<waplot type='MathematicaSyntax' alt='graph of y = 1/(x + $va) with vertical asymptote -$va'>
    Plot[
        1/(x + $va), 
        {x, -11,11},  
        Exclusions->{x==-$va}, 
        ExclusionsStyle->Directive[Black, Dashed], 
        PlotRange->{{-10,10}, {-10,10}}, 
        AxesLabel->{x, y}, 
        AspectRatio->Automatic, 
        PlotStyle->Directive[Red, Thick]
    ]
</waplot>
</div>
<em>x</em> = <_>

Answer

<EQN -$va> {tab} 0.5

Display to Students

Question as displayed to students