Plot a simple non-asymptotic function using Mathematica®.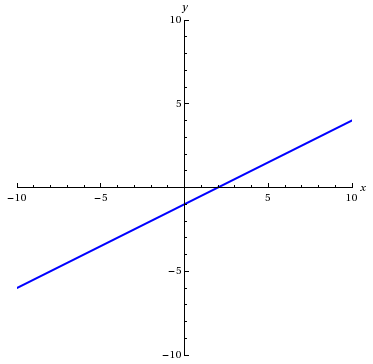
Graphing a Function
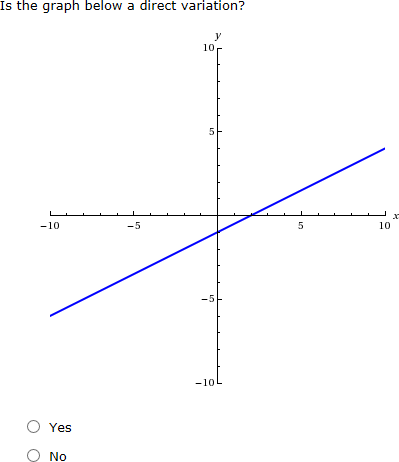
The following table summarizes an actual question.
|
QID |
|
|---|---|
|
Name |
|
|
Mode |
|
|
Question |
|
|
Answer |
|
|
Display to Students |
|
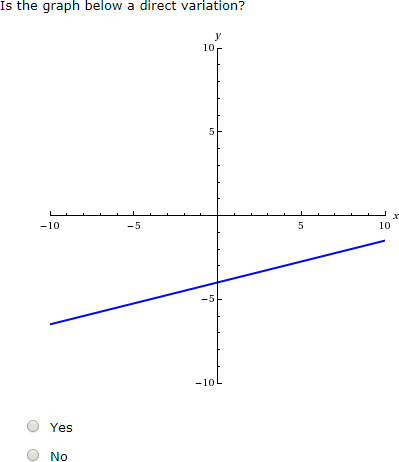
Graphing a Randomized Function
The following table summarizes an actual question.
|
QID |
|
|---|---|
|
Name |
|
|
Mode |
|
|
Question |
|
|
Answer |
|
|
Display to Students |
|