Plot Points with WAPlot

Plot points on an xy-plane using Mathematica® syntax.
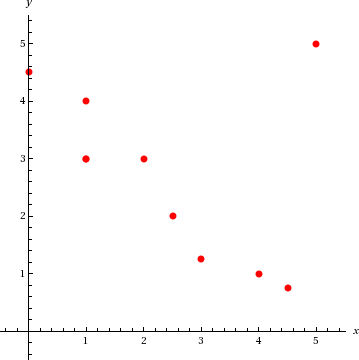
Points (0, 4.5), (1, 3), (4, 1), (5, 5), (3, 1.25), (1, 3), (2.5, 2), (4.5, 0.75), (2, 3), (1, 4) plotted on an xy planex 1

This type of Mathematica graph is primarily used to plot individual points and scatterplots.
  1. Click Questions > Create.
    The Question Editor opens.
  2. In Name, type a name for the question.
  3. In Mode, select one of the question modes to define the basic behaviors for your question.
  4. In Question, type your question.

    Use the answer placeholder string <_> to specify where the answer box should be displayed.

  5. In Answer, specify the answer key for your question. Often, you will specify distractors or options configuring your question's behavior.
  6. Add WAPlot tags to the question, answer, or solution field of a question.
    If a WAPlot image is used in the answer field, the question mode must be multiple-choice, and there cannot be linebreaks in the WAPlot code. WAPlot images cannot be placed in assignment descriptions.
    <waplot type='MathematicaSyntax'> </waplot>
  7. Insert the Mathematica code for your function inside the WAPlot tags.
    <waplot type='MathematicaSyntax'>
        ListPlot[
            {{0, 4.5}, {1, 3}, {4, 1}, {5, 5}, {3, 1.25}, {1, 3}, {2.5, 2}, {4.5, 0.75}, {2, 3}, {1, 4}},         
            PlotRange->{{-.5, 5.5},{-.5,5.5}},
            AxesLabel->{x, y}, 
            AxesOrigin->{0, 0},
            AspectRatio->Automatic,
            PlotStyle->{Red, PointSize[.02]}
        ]
    </waplot>
  8. In the <waplot> tag, use the @alt attribute to add alternative text describing the image for students using screen readers.
    
    <waplot type='MathematicaSyntax' alt='Points (0, 4.5), (1, 3), (4, 1), (5, 5), (3, 1.25), (1, 3), 
    (2.5, 2), (4.5, 0.75), (2, 3), (1, 4) plotted on an xy plane'>
    Make sure the content of the alternative text is appropriate to the pedagogy of your question.

Plotting Points

The following table summarizes an actual question.

QID

3986550

Name

Template2 6.WAPLOT.05.

Mode

Multiple-Choice

Question

Which data point is the outlier?
<figure>
    <waplot type='MathematicaSyntax' alt='Points (0, 4.5), (1, 3), (4, 1), (5, 5), (3, 1.25), (1, 3), (2.5, 2), (4.5, 0.75), (2, 3), (1, 4) plotted on an xy plane'>
        ListPlot[
            {{0, 4.5}, {1, 3}, {4, 1}, {5, 5}, {3, 1.25}, {1, 3}, {2.5, 2}, {4.5, 0.75}, {2, 3}, {1, 4}}, 
            PlotRange->{{-.5, 5.5},{-.5,5.5}},
            AxesLabel->{x, y}, 
            AxesOrigin->{0, 0},
            AspectRatio->Automatic,
            PlotStyle->{Red, PointSize[.02]}
        ]
    </waplot>
</figure>
<_>

Answer

(5, 5)
There is no outlier.
(3, 1.25)
(4, 1)

Display to Students

Question as displayed to students