Create Graphing Questions

A graphing question provides a graphing tool in the question for students to graph points, lines, segments, rays, circles, parabolas, and inequalities on a Cartesian coordinate plane. Graphing questions are automatically scored.

  1. Click Questions > Create. The Question Editor opens.
  2. In Name, type a name for the question.
  3. In Mode, select Graphing.
  4. In Question, type your question. Use the answer placeholder string <_> to specify where the graphing tool should be displayed.
  5. In Answer, type notation that describes the objects that you want the student to graph and the appearance of the grid. Each line in Answer represents a separate answer and defines a new graph, so do not press ENTER unless you wish to have the student create multiple separate graphs.
    The following table describes the notation used to specify the objects that you want the student to graph. If the student needs to graph more than one object, separate each object with a semicolon, for example:
    point:(9,3);point:(6,7);point:(2,2)

    Object

    How to specify answer

    Examples

    point

    Specify the point coordinates.

    point: (x, y)
    point: (-9, 3)

    line

    Specify a linear equation for x and y, or specify two points on the line.

    line: y = m*x + b 
    line: y - k = m * (x - h) 
    line: (x1,y1), (x2,y2)
    line: y = 3*x - 6
    line: (0,-6), (2,0)

    ray - closed endpoint

    Specify the endpoint of the ray, followed by another point on the ray.

    ray: [(x1,y1), (x2,y2))
    ray: [(0,0), (4,4))

    ray - open endpoint

    Specify the endpoint of the ray, followed by another point on the ray.

    ray: ((x1,y1), (x2,y2))
    ray: ((5,0), (10,12))

    line segment - closed endpoints

    Specify the endpoints of the line segment.

    segment: [(x1,y1), (x2,y2)]
    segment: [(5,0), (4,0)]

    line segment - open endpoints

    Specify the endpoints of the line segment.

    segment: ((x1,y1), (x2,y2))
    segment: ((212,45), (52,10))

    line segment - closed and open endpoints

    Specify the endpoints of the line segment.

    segment: ((x1,y1), (x2,y2)]
    segment: [(x1,y1), (x2,y2))
    segment: ((5,0), (52,10)]
    segment: [(5,0), (52,10))

    circle

    Specify the center coordinates and radius of the circle or specify an equation.

    circle: (a, b), r 
    circle: (x-a)^2 + (y-b)^2 =r^2
    circle: (4, 3), 5
    circle: (x-4)^2+(y-3)^2 = 25

    parabola - vertical axis

    Specify an equation for the parabola in the following form, or specify its vertex, a second point, and orientation:

    parabola: y = a*x^2 + b*x + c 
    parabola: (x1,y1), (x2,y2), V
    parabola: y = (x^2)/4 + 2*x - 6
    parabola: (3,3), (5,5), V

    parabola - horizontal axis

    Specify an equation for the parabola in the following form, or specify its vertex, a second point, and orientation:

    parabola: x = a*y^2 + b*y + c 
    parabola: (x1,y1), (x2,y2), H
    parabola: x = y^2 - 2*y
    parabola: (3,3), (5,5), H

    dashed line or parabola

    Prefix the keyword line or parabola with the keyword dashed.

    dashed line: y = 3*x - 6
    dashed parabola: (3,3), (5,5), H

    linear inequality

    Specify an equation for the linear inequality.

    region: y > m*x + b 
    region: y >= m*x + b 
    region: y < m*x + b 
    region: y <= m*x + b 
    region: y - k > m * (x - h) 
    region: y - k >= m * (x - h) 
    region: y - k < m * (x - h) 
    region: y - k <= m * (x - h)
    region: y - 5 >= 3*x

    circular inequality

    Specify an equation for the circular inequality in the following form:

    region: (x-a)^2 + (y-b)^2 > r^2
    region: (x-4)^2+(y-3)^2 <= 25

    parabolic inequality

    Specify an equation for the parabolic inequality using the same form as for a parabola.

    region: y > a*x^2 + b*x + c 
    region: x <= a*y^2 + b*y + c
    region: x > 3*y^2 - 5*y + 6

    intersection of inequalities

    Specify equations for each inequality on the same line, separated by semicolons.

    region:y >= x^2 - 5; region:y < 2

    no solution

    Specify the following code for a question with no solution:

    nosol
    nosol
  6. Optional: Type a Solution.

    The solution helps your students understand the steps they need to take to determine the correct answer to the question. Your assignment settings specify when to show the solution.

  7. Click Test/Preview to test the appearance and behavior of the question. See Test Questions.
  8. Click Redisplay to show certain kinds of errors in the Display section of the Question Editor. Make any needed changes to your question.
  9. Optional: Click Show Additional Information and change the question's sharing permission or add descriptive information.
    • By default, other instructors can use your question only if you provide them with the question ID, and only you can edit the question or find it in search results. To change the permission, see Share Questions With Other Instructors.
    • If you make your question publicly available, you might want to provide descriptive information to help others search for it. See Add Search Metadata to Questions.
  10. When your question displays and functions correctly, click Save.

    WebAssign assigns it a unique question ID (QID), which is displayed in parentheses after the question name.

    You can use your question in an assignment and see it in your My Questions list only after it is saved.

Example Graphing Question 

The following table summarizes an actual question.

QID

1077759

Name

Template2 4.GRAPH.01.

Mode

Graphing

Question

<watex>Graph the equation \[y = 3x + 5\].</watex><br>
<_>

Answer

line: y=3*x+5

Display to Students

Graph the equation y = 3x + 5.
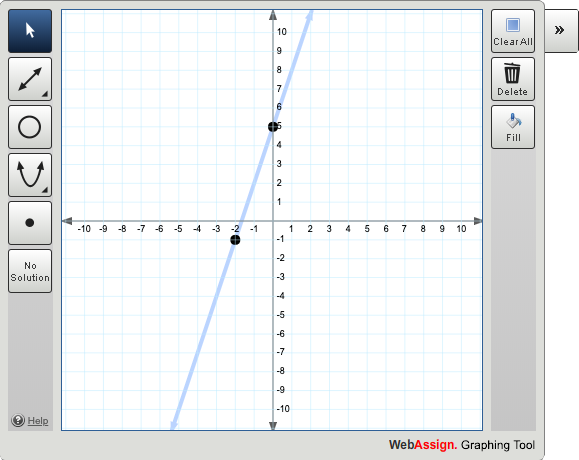
Question as displayed to students