
Simple Harmonic Motion – Procedure
Equipment
- Stand apparatus (table clamp, vertical bar, horizontal arm)
- Spring
- Slotted masses and hanger
- Pendulum bob
- Meterstick
Procedure
Please print the worksheet for this lab. You will need this sheet to record your data.
Spring Oscillations
You will be using two different principles to determine the stiffness of a spring, and also comparing the outcomes of two methods. One method involves measuring the stretch resulting from an applied force and using Hooke's Law, The second method involves measuring the oscillation period of a mass hanging on the spring and using the relationship among mass, spring constant, and oscillation period, For more details about these equations, see Simple Harmonic Motion – Concepts.Using Hooke's Law
1
Pick any color of spring to use, and hang it on the horizontal arm of the stand. Make sure to record the spring color in WebAssign or the rest of your questions will be marked incorrect.
2
Consult Table A to determine what mass values to use with your spring. Remember to account for the mass hanger (all hangers are 50 g).
3
Hang mass m1 from the hanger, record the total length of the spring (not including the hanger or masses), repeat with mass m2, and record the values in Table 1.
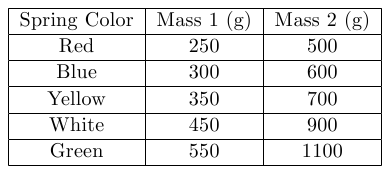
Table A: Mass Values
4
Use Hooke's Law to calculate the spring constant from the difference between the two measurements. See Simple Harmonic Motion – Concepts for more details about this calculation.
5
The actual spring constant is written on the box for the springs. What is the percent error of your measurement as compared to the actual value?
Using a Graph of T2 vs. m
1
Suspend the m1 for your spring color (see Table A) on the spring. Give the mass a small displacement (3–4 cm) and let it start bouncing. Try to ensure it moves vertically without side-to-side swinging.
2
Measure the time for 10 complete oscillations and record it in Table 2. Taking 10 oscillations will give more accurate results with less error due to measurement.
3
Perform three total trials, averaging the times together, to increase accuracy. Finally, determine the period of a single oscillation from this average time.
4
Repeat the measurements three more times, doing three trials of each. Use values between m1 and m2 for the second and third measurements, then use m2 for the last set.
5
Using linear regression and the equations of simple harmonic motion, determine the value of the spring constant.
6
Calculate the percent difference between the two values of the spring constant.
7
What is the percent error of your measurement as compared to the actual value?
Simple Pendulum
For a simple pendulum (a point mass suspended on a light string), the relationship among period, pendulum length L, and the acceleration due to gravity is very similar to the mass-spring equationT = 2π
.
above. If the pendulum is moving only through small angular distances, the relation is
 |
|
Using a Graph of T2 vs. L
1
Construct a simple pendulum by hanging the metal bob by a string from the horizontal bar of the stand assembly.
2
Record the length of the pendulum. Note that the length should be the distance from the pivot point to the center of mass of the pendulum bob.
3
Using the same methods as you used with the mass and spring, determine the amount of time for ten oscillations with multiple trials averaged together, and then calculate the experimental value of the period.
4
Change the length of the pendulum by at least 20 cm and follow all the steps above. Do four total measurements, varying the length by at least 20 cm.
Caution:
Use only small displacement angles when swinging the pendulum (less than 20° from vertical) and don't use a pendulum length less than 50 cm.
Use only small displacement angles when swinging the pendulum (less than 20° from vertical) and don't use a pendulum length less than 50 cm.
5
Using linear regression and the equations of simple harmonic motion, determine the experimental value of the acceleration due to gravity.
6
What is the percent error of your measurement as compared to the actual value?
7
Look at the values of L and Tobserved in Table 3. What is the shape of the graph that correctly represents the relationship between T versus L?