
Lab 9 - Titration Curves
Purpose
To determine the equivalence points of two titrations from plots of pH versus mL of titrant added.Goals
-
1To gain experience performing acid-base titrations with a pH meter.
-
2To plot titration curves of pH vs mL of titrant added.
-
3To determine the equivalence point of a titration from a titration curve.
-
4To determine the pKa of an analyte from a titration curve.
Introduction
A titration is an analytical procedure in which a reaction is run under carefully controlled conditions. The stoichiometric volume of one reactant of known concentration, the titrant, that is required to react with another reactant of unknown concentration, the analyte, is measured. The concentration of the analyte is determined from the concentration and volume of titrant and the stoichiometry of the reaction between them. The experimental setup is shown in Figure 1. A buret, which contains the titrant, is calibrated so the volume of solution that it delivers can be determined with high accuracy and precision. Titrant is added to the analyte until the stoichiometric volume of titrant has been added. This is called the equivalence point, at which the volume of titrant delivered by the buret is read. Usually, the volume readings are estimated to the nearest 0.01 mL. The delivery of the titrant is adjusted with the stopcock on the buret. With practice, one can dispense fractions of a drop of titrant and control the procedure well enough that replicated titrations agree within 0.10 mL.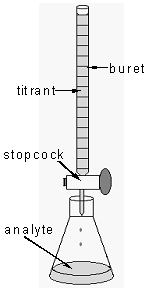
Figure 1: Titration Setup
( 1 )
HP−(aq) + OH−(aq) → P2−(aq) + H2O(l)
( 2 )
CO32−(aq) + H3O+(aq) → HCO3−(aq) + H2O
( 3 )
HCO3−(aq) + H3O+(aq) → H2CO3(aq) + H2O(l)
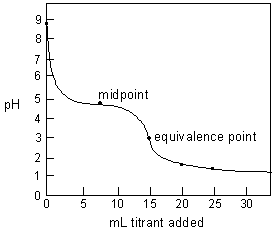
Figure 2: Predicted titration curve of 0.1 M NaC2H3O2 titrated with 0.20 M HCl
( 4 )
HCO3−(aq) + H2O(l) → CO32−(aq) + H3O(aq)
( 5 )
HCO3−(aq) + H2O(l) → H2CO3(aq) + OH−(aq)
( 6 )
pH = 1/2(pKa1 + pKa2)
 As a reminder on concentration units: molarity is defined as the number of moles of solute in a liter of solution. This is numerically equal to the number of millimoles of solute in a milliliter of solution. It is often convenient to use this second definition of molarity in titrations and other work where small quantities are involved.
Note that the volume measurements in titrations are usually reported to four significant figures, so the concentrations are usually reported to four significant figures as well. Watch this in your work.
As a reminder on concentration units: molarity is defined as the number of moles of solute in a liter of solution. This is numerically equal to the number of millimoles of solute in a milliliter of solution. It is often convenient to use this second definition of molarity in titrations and other work where small quantities are involved.
Note that the volume measurements in titrations are usually reported to four significant figures, so the concentrations are usually reported to four significant figures as well. Watch this in your work.
Equipment
-
1MicroLab Interface
-
1MicroLab pH Measurement Instruction Sheet
-
1pH electrode in pH 7.00 buffer
-
230 mL beakers
-
250 mL beakers
-
1250 mL beaker
-
1100 mL graduated cylinder
-
120.00 mL volumetric pipet
-
1pipet bulb
-
1magnetic stir plate
-
1magnetic stir bar
-
125 mL buret
-
1ring stand
-
1clamp
-
1buret clamp
-
1250 mL beaker for electrode rinsings
-
1deionized water squirt bottle
-
1box of Kimwipes
Reagents
-
~25 mL0.20 M potassium hydrogen phthalate (KHP)
-
~30 mL0.20 M sodium hydroxide (NaOH)
-
3 dropsphenolphthalein solution
-
~25 mL0.10 M sodium carbonate (Na2CO3)
-
~30 mL0.20 M hydrochloric acid (HCl)
-
3 dropsmethyl orange solution
-
~15 mLpH 4.00 buffer
-
~15 mLpH 7.00 buffer
-
~15 mLpH 10.00 buffer
-
~200 mLdeionized water
Safety
Potassium hydrogen phthalate is listed as an irritant. Sodium carbonate is listed as both toxic and an irritant. However, the concentrations of these materials are quite low. If you spill any of these chemicals on skin or clothing, rinse the area immediately with water. HCl and NaOH are corrosive. They can attack the skin and cause permanent damage to the eyes. If either solution splashes into your eyes, use the eyewash immediately. Hold your eyes open and flush with water for at least 15 minutes. If contact with skin or clothing occurs, immediately rinse the affected area with water for at least 15 minutes. Have your lab partner notify your teaching assistant about the spill and your exposure. The chemicals used in this experiment are reasonably dilute so gloves will not be available. The NaOH solution has an alkalinity similar to that of oven cleaner or bleach solution. The HCl solution has an acidity close to that of stomach acid. Remember to wash your hands with soap and water when the experiment is completed.Waste Disposal
All solutions can be disposed of down the sink drain followed by flushing with plenty of water.Prior to Class
Please read the following sections of the Introductory Material: Please review the following videos: Please complete your WebAssign prelab assignment. Check your WebAssign account for due dates. Students who do not complete the WebAssign prelab assignment are required to print and hand in the prelab worksheet.
Lab Procedure
Please print the worksheet for this lab. You will need this sheet to record your data.
-
•Electrodes are kept in standard pH 7 buffer solution when not in use.
-
•Immediately prior to use, the electrodes are rinsed with deionized water and gently blotted with a Kimwipe, then placed in the test solution.
-
•The electrodes are rinsed and blotted again after the measurement and returned to the pH 7 buffer solution.
Part A: Calibrating the MicroLab pH Electrode
1
Open the MicroLab program.
2
Make sure the pH electrode is plugged into the interface.
3
Calibrate the pH electrode using the MicroLab instructions provided in the lab.
4
After the calibration is complete, measure the pH of each of the three buffer solutions of pH = 4.00 (red), pH = 7.00 (yellow), and pH = 10.00 (blue). Record the value in the digital display in WebAssign as a record of how accurately the probe is calibrated. Make sure the electrode is immersed in the solution and allow for a few seconds equilibration
5
After the calibration is complete, continue with the MicroLab instructions provided. The program will be configured to accept a volume of titrant, read from the buret, for each pH measurement.
6
For each pH reading, you will be prompted for a keyboard entry; enter the total volume of titrant as read from the buret. Make sure the electrode is immersed in the solution and allow for a few seconds equilibration.
Part B: Titration of KHP with NaOH
1
Using a clean, dry 50 mL beaker, obtain about 25 mL of 0.20 M potassium hydrogen phthalate (KHP) solution. Record the exact concentration of the KHP in Data Table A.
2
Condition a 20.00 mL volumetric pipet with KHP solution as shown in the Pipeting Techniques video linked to in the PRIOR TO CLASS section above and as described in the "Volumetric Glassware" section of the Introductory Material in this lab manual, which is also linked to in PRIOR TO CLASS above.
3
Pipet 20.00 mL of the potassium hydrogen phthalate (KHP) solution into a 250 mL beaker, and add 100 mL of deionized water (graduated cylinder) and 3 drops of phenolphthalein indicator.
4
Obtain about 30 mL of 0.20 M NaOH solution in a clean, dry 50 mL beaker. Record the exact concentration of NaOH in Data Table A.
5
Condition the 25.0 mL buret with NaOH solution as shown in the "Conditioning a Buret" video linked to in the PRIOR TO CLASS section above and as described in the "Volumetric Glassware" section of the Introductory Material in this lab manual.
6
Fill the buret with NaOH and carefully clamp it with the buret clamp to the ring stand.
7
Carefully slide the stir bar into the 250 mL beaker while tilted to avoid splashing or damage to the beaker. Position the stir plate under the 250 mL beaker and begin stirring slowly.
8
Carefully position the pH electrode in the 250 mL breaker until about 1/2 inch of the tip is in the solution. Clamp to the ring stand with the clamp provided. Be sure that the stir bar will not strike the pH electrode. If necessary, add more water from a graduated cylinder. See Figure 3 for the complete setup.
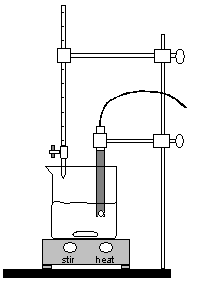
Figure 3: Experimental Setup
9
Position the buret so that the tip of the buret is just inside the beaker. Refer to Figure 3
Table A: Titration of KHP
Question 1: From the values in Data Table A, calculate the theoretical equivalence volume (Veq) for your KHP titration. Record this value in Data Table A.
10
Take an initial pH reading by entering the initial buret reading in the MicroLab software window and hitting return. You should also record all of your data by hand in Data Table B just in case something goes wrong with the computer. Remember to read the buret to the nearest 0.01 mL. Reading a buret to this accuracy is tricky, so do the best you can, but recall that the last significant figure is expected to be an estimate.
11
Add the titrant in 2 mL increments from the buret, stirring for about 15 seconds after each incremental addition. Then read the exact volume on the buret, enter this value into the MicroLab software and take a pH reading. Remember to record your measurements by hand in Data Table B. Please be sure to record the pH at 10.00, 15.00, 20.00 and 22.00 mL titrant, as you will need to enter those pH values into Data Table C on your InLab assignment.
12
When the pH begins to change more rapidly (or when you are within 2 mL of the predicted equivalence point), the increments of titrant should be changed to 0.5 mL. Note the pH range over which the indicator changes color in the "Observations' column of Data Table B.
13
Return to 2 mL increments of titrant as the changes in pH decrease beyond the equivalence point. Do not stop the titration until you have added approximately 5 mL of titrant beyond the equivalence point.
Table B: Volume of Titrant Added to KHP vs pH
14
When you are finished with your titration, stop the MicroLab data collection program. Carefully remove the pH electrode from the solution, rinse it off and place it in the pH 7 buffer until you are ready to use it in Part C.
15
Drain the remaining titrant into the analyte beaker. Discard all remaining solutions down the drain, followed by flushing with plenty of water.
16
Rinse and dry all of the glassware for use in Part C. Simply rinse the buret and pipet a few times with deionized water. It is not necessary to dry them since you will be conditioning them before use in Part C.
17
Use the MicroLab software to generate a graph. Ensure this plot has a title, axis labels and units where appropriate. Show this plot to your TA for manual grading of your work.
Question 2a: From your titration curve, what is the experimental Veq for your KHP titration? Do not forget to subtract the initial buret reading when determining your Veq.
Question 2b: How do your theoretical and experimental equivalence volumes compare? What is their percent error?
-
% error =
x 100calculated - measured calculated
18
Complete Data Table C below with pH values from your prelab assignment and pH values from your KHP titration curve.
Table C: Calculated vs Measured pH's for KHP Titration
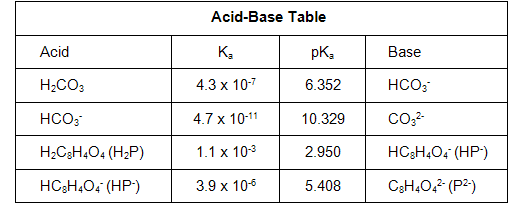
Question 3a: What is the experimental pKa value for hydrogen phthalate (HP- or HC8H4O4-) that you found at the midpoint of your KHP titration curve?
Question 3b: The accepted value for the pKa of HP- is 5.408. How does this compare to your experimental value? What is their percent difference?
Question 4: How did the endpoint indicated by the phenolphthalein compare to the equivalence point determined by the titration curve? What conclusion can you make about the need for an indicator in a pH titration?
Part C: Titration of Na2CO3 with HCl
1
Rinse the 20.00 mL volumetric pipet from Part B with deionized water a few times to remove any remaining KHP solution.
2
Using a clean, dry 50 mL beaker, obtain about 25 mL of 0.10 M sodium carbonate (Na2CO3) solution. Record the exact concentration of the Na2CO3 in Data Table D.
3
Condition the 20.00 mL volumetric pipet with Na2CO3 solution as shown in the Pipeting Techniques video linked to in the PRIOR TO CLASS section above and as described in the "Volumetric Glassware" section of the Introductory Material in this lab manual.
4
Pipet 20.00 mL of the sodium carbonate (Na2CO3) solution into a 250 mL beaker, and add 100 mL of deionized water (graduated cylinder) and 3 drops of methyl orange indicator.
5
Obtain about 30 mL of 0.20 M HCl solution in a clean, dry 50 mL beaker. Record the exact concentration of HCl in Data Table D.
6
Condition the 25.0 mL buret with HCl solution as shown in the "Conditioning a Buret" video linked to in the PRIOR TO CLASS section above and as described in the "Volumetric Glassware" section of the Introductory Material in this lab manual.
7
Fill the buret with HCl and carefully clamp it with the buret clamp to the ring stand.
8
Carefully slide the stir bar into the 250 mL beaker while tilted to avoid splashing or damage to the beaker. Position the stir plate under the 250 mL beaker and begin stirring slowly.
9
Carefully position the pH electrode in the 250 mL beaker until about 1/2 inch of the tip is in the solution. Clamp to the ring stand with the clamp provided. Be sure that the stir bar will not strike the pH electrode. If necessary, add more water from a graduated cylinder. See Figure 3 for the complete setup.
10
Position the buret so that the tip of the buret is just inside the beaker. Refer to Figure 3.
Table D: Titration of Na2CO3
Question 5: From the values in Data Table D, calculate the theoretical first and second equivalence volumes (Veq's) for your Na2CO3 titration.
11
Take an initial pH reading by entering the initial buret reading in the MicroLab software window and hitting return. You should also record all of your data by hand in Data Table E just in case something goes wrong with the computer.
12
Add the titrant in 2 mL increments from the buret, stir about 15 seconds. Then read the exact volume on the buret, enter this value into the MicroLab software and take a pH reading. Remember to record your measurements by hand in Data Table E. Please be sure to record the pH at 5.00, 10.00, 15.00, 20.00, and 22.00 mL of titrant, as you will need to enter those pH values into Data Table C on your InLab assignment.
13
When the pH begins to change more rapidly (or when you are within 2 mL of the predicted first equivalence point), the increments of titrant should be changed to 0.5 mL.
14
Return to 2 mL increments of titrant as the changes in pH decrease beyond the first equivalence point.
15
When the pH begins to change more rapidly (or when you are within 2 mL of the predicted second equivalence point), the increments of titrant should be changed to 0.5 mL. Note the pH range over which the indicator changes color in the observations column of Data Table E.
16
Return to 2 mL increments of titrant as the changes in pH decrease beyond the second equivalence point. Do not stop the titration until you have added approximately 5 mL of titrant beyond the second equivalence point.
17
When you are finished with your titration, stop the MicroLab data collection program. Carefully remove the pH electrode from the solution, rinse it off and place it in the pH 7 buffer as you found it at the beginning of the lab period.
18
Drain the remaining titrant into the analyte beaker. Discard all remaining solutions down the drain followed by flushing with plenty of water.
19
Rinse and dry all of the glassware and return it to the setup area. Simply rinse the buret and pipet a few times with deionized water. It is not necessary to manually dry them. Simply clamp them upside down in the buret clamp with the stopcock of the buret open so they will dry on their own. Please refer to the "Cleaning and Storing a Buret" video linked to in the PRIOR TO CLASS section above for more details.
Table E: Volume of Titrant Added to Na2CO3 vs pH
20
Use the MicroLab software to generate a graph. Ensure this plot has a title, axis labels, and units where appropriate. Show this plot to your TA for manual grading of your work.
21
When you are finished, close MicroLab.
Question 6a: From your titration curve, what are the experimental first and second Veq's for your Na2CO3 titration? Do not forget to subtract the initial buret reading when determining your Veq's.
Question 6b: How do your theoretical and experimental equivalence volumes compare? What are their percent error?
22
Complete Data Table F in the Data Collection section of the lab manual with pH values from your prelab assignment and pH values from your Na2CO3 titration curve.
Table F: Calculated vs Measured pH's for Na2CO3 Titration
Question 7a: What are the experimental pKa values for carbonic acid (H2CO3) and hydrogen carbonate (HCO3-) that you found at the midpoints of your Na2CO3 titration curve?
Question 7b: The accepted values for the pKa's of H2CO3 and HCO3- are 6.352 and 10.329, respectively. How do these compare to your experimental values? What are their percent error?
Question 8: How did the endpoint indicated by the methyl orange compare to the equivalence points determined by the titration curve? What conclusion can you make about the need for an indicator in a pH titration?
23
Before leaving, enter your results in the InLab assignment. If all results are scored as correct, log out. If not all results are correct, try to find the error or consult with your teaching assistant. When all results are correct, note them and log out of WebAssign. The InLab assignment must be completed by the end of the lab period. If additional time is required, please consult with your teaching assistant.