
Lab Investigation 4 - How Fast Does the Crystal Violet Decolorize?
Guiding Question
What is the rate law for decolorization of crystal violet?Introduction
Crystal violet is used to dye paper and as a component of navy blue and black inks for printing, ballpoint pens, and ink jet printers. It is also used to colorize diverse products such as fertilizers, antifreezes, detergents, and leather jackets. Crystal violet decolorizes in the presence of hydroxide ions, which can limit its usefulness as a dye or ink; on the other hand, it makes crystal violet a useful pH indicator. This process is illustrated with Equation 1.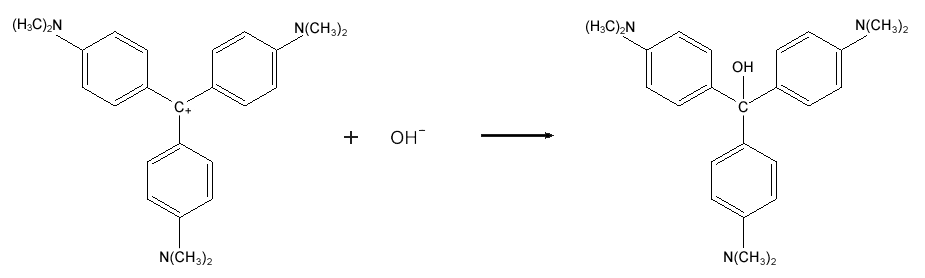
Figure : Equation 1
( 2 )
CV+ + OH− → CVOH.
[OH−]
is first order, you will design and carry out an experiment to determine the order of the decolorization reaction with respect to [CV+] and the value of the rate constant, k.
Fundamentals of Chemical Kinetics
The rate of a reaction is expected to depend on the concentrations of reactants and possibly other substances. A rate law represents the dependence of the rate on concentrations, for example( 3 )
rate = k[A]x[B]y
 You may have noticed that we only list three integrated rate laws, ignoring rate laws like rate = k[A][B]. That doesn't mean we can't use integrated rate laws to determine the rate law for those types of reactions; we just have to separate the two components. In order to determine the order of each component of a two-component rate law, we can make the concentration of one component, for example B, so large as compared to A that the concentration of B is almost constant. Assuming that the concentration of B is constant, the reaction becomes pseudo-order, and the rate constant is termed a pseudo k.
Goals
As you complete this investigation you will:-
1Design an experiment that can measure the rate of decolorization of crystal violet in basic solutions as a function of time.
-
2Determine the rate law for this reaction including the actual value of k.
Materials Available for Use
-
1.0 × 10⁻⁴ M crystal violet solution
- 0.10 M NaOH(aq)
- 1.0 M HCl(aq) (for cleaning glassware)
- Spot plate
- Pipettors and tips
- Kimwipes
- Vernier LabPro system with colorimeter
- Cuvettes
Safety Precautions
Caution:
Wear goggles at all times.
Wear goggles at all times.
Caution:
Neutralize any excess liquid solutions and wash down the sink with water.
Neutralize any excess liquid solutions and wash down the sink with water.
Caution:
HCl and NaOH are corrosive. They can attack the skin and cause permanent damage to the eyes. If one of these solutions splashes into your eyes, use the eyewash station immediately. Hold your eyes open and flush with water. If contact with skin or clothing occurs, flush the affected area with water.
HCl and NaOH are corrosive. They can attack the skin and cause permanent damage to the eyes. If one of these solutions splashes into your eyes, use the eyewash station immediately. Hold your eyes open and flush with water. If contact with skin or clothing occurs, flush the affected area with water.
Caution:
Be careful handling the crystal violet solution. It can stain skin and clothing. Gloves are available for you to wear.
Be careful handling the crystal violet solution. It can stain skin and clothing. Gloves are available for you to wear.
Getting Started
Your first task is to prepare a Beer's law calibration curve for absorbance versus concentration of crystal violet, [CV+].
1.0 × 10⁻⁴ M
crystal violet solution. Now add a drop of 0.10 M NaOH(aq) (this represents a large excess of hydroxide ion).
Procedure
1
You need to make sure that your decolorization reaction occurs within the linear range of your calibration curve and that you have a large excess of hydroxide ion, OH−.
Based upon the fact that one or more data points were dropped from your calibration curve, two dilutions should place your experiment in the linear range.
2
Make the first dilution with distilled water and the second with 0.10 M NaOH. This will give you a large excess of NaOH.
3
Have the colorimeter calibrated and ready before you perform the hydroxide dilution.
4
Fill the cell; then click start on the computer.
5
Your experiment should monitor the reaction until the absorbance value of the reaction mixture is 0.20 or less.
6
Use the regression equation from your calibration curve to find the concentration at the selected time intervals over the entire range of data.
7
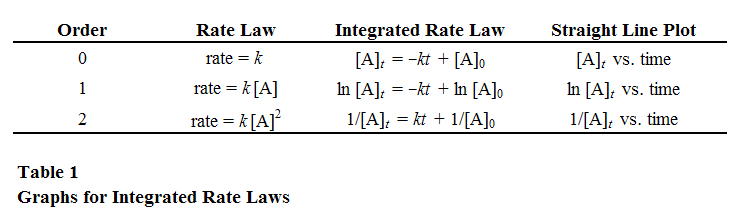
Plot the concentration and time data, for zero, first, and second order reactions. Based on the correlation coefficient, determine the order.
8
Once you decide on the order, determine pseudo k from the slope.
9
Determine actual k, using the initial concentration of NaOH.
Interactive Poster Session
Once your group has completed your work, prepare a whiteboard that you can use to share and justify your ideas. See the handout provided for details on this process.Report
Once you have completed your research, you will need to prepare an investigation report that consists of three sections. This report may require more than 2 pages with data tables. This report must be typed and any diagrams, figures, or tables should be embedded into the document.- Section 1: What concept were you investigating, and how does it relate to the guiding question? How fast does crystal violet decolorize? Describe how kinetics concepts will allow determination of rate law using graphical analysis of integrated rate laws.
- Section 2: How did you go about your work and why did you conduct your investigation in this way? Specifically, what technique is used to monitor the reaction and how is the Beer-Lambert calibration curve used?
- Section 3: What is your argument? Your report should include the linear regression equation from the Beer-Lambert calibration curve along with the correlation coefficient; one sample calculation of how concentration at a selected time was determined; a data table with selected time and concentration values; the results from integrated rate law graphical analysis to determine order; how the actual value of the rate constant, k, was determined; and the complete rate law with the actual value of k included in the rate law with the correct units.
- This third section is where you not only present your data, but use the values you obtain as evidence in your reasoning. Statements like, "see data table for values" are not acceptable!
Remember: An argument is not just an answer to the question. It is a claim or conclusion supported by evidence with a rationale for why the evidence supports the claim or conclusion.