
Lab 1 - Electrical Measurements and Error Analysis
Introduction
If you want to design and test a hypothesis in your field of scientific research, you will have to collect data through observation or experimentation. You will then have to analyze the data and come up with a reasonable conclusion that might or might not validate your hypothesis. To stand the test of time, these results must be repeatable under similar conditions by you or by other scientists. The purpose of this laboratory exercise is to acquaint you with basic scientific conventions for measuring electrical quantities and for analyzing the data obtained from those measurements. You will learn how to account for the experimental uncertainties that inevitably arise when using electrical instruments. You will learn the difference between uncertainties in measurement and uncertainties propagated through calculations. This lab is divided into two separate activities. In the first activity, you will calibrate a power supply by measuring the output voltage. In the second activity, you will use an ohmmeter to measure the resistance of a group of resistors and calculate the standard deviation. You will also measure the equivalent resistance of series and parallel combinations and compare them to the calculated value.Discussion of Principles
Calibrating a Power Supply
Electrical instruments do not always give accurate measurements. The accuracy of the readings you take will depend, partly, on how well the instrument has been calibrated. A simple calibration process involves setting the power supply to a particular voltage and using a second device, like a voltmeter, to measure the output voltage from the power source. By taking several readings for increasing output voltage, it is possible to measure the linearity of the output. You will be using a signal interface as the voltage source and connect it in series with a bulb to monitor the change in brightness of the bulb as the voltage is increased. Fig. 1 is a circuit diagram of the connections you will need to make.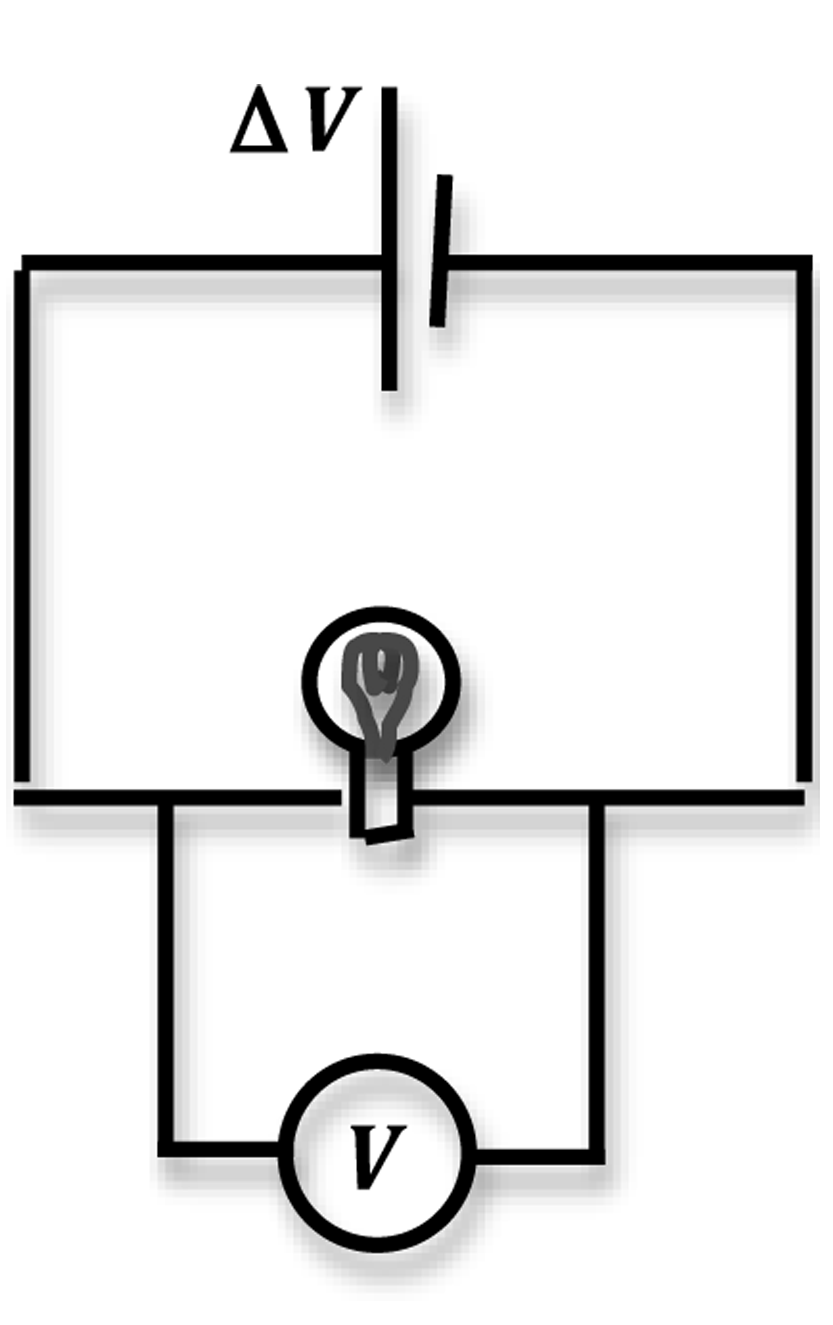
Figure 1: Circuit diagram for calibrating a voltage source
Measuring Resistance and Determining Standard Deviation
You are given a set of resistors of equal value. By measuring the resistance of this set you can determine the standard deviation in the sample set of resistors. The sample standard deviationσX
of N measurements of a quantity is given by the square root of the bias corrected variance
( 1 )
σX2 =
| 1 |
| N − 1 |
| N | (X − Xi)2 |
 | |
| i |
X
is the mean of the N measurements. You can compare the standard deviation to the resistors' tolerance given by the manufacturer.
You will use small cylindrical ceramic resistors.
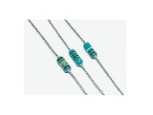
Figure 2: Color-coded ceramic resistors
Reading the Color Code
The resistance of most ceramic resistors can be determined from the colored bands printed on the resistor. Each color represents a digit from 0 to 9.| black | 0 | green | 5 | |
| brown | 1 | blue | 6 | |
| red | 2 | violet | 7 | |
| orange | 3 | gray | 8 | |
| yellow | 4 | white | 9 |
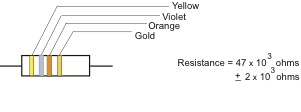
Figure 3: Reading the color code
R1
and R2
are two resistors, then the combined resistance value of these two in series will be
( 2 )
Req = R1 + R2
Req
will be given by the sum rule. See Appendix C.
When the two resistors are connected in parallel, they will have combined resistance given by
( 3 )
| 1 |
| Req |
| 1 |
| R1 |
| 1 |
| R2 |
Req
see Appendix C.
Using a multimeter as an ohmmeter (see Appendix K), you will measure the resistance of the set of individual resistors and determine the standard deviation in the measurements. You will take pairs of resistances and measure the combined series and parallel values. You will then compare the measured value to the calculated value and determine the percent uncertainty in your measurements.
Objective
The purpose of this laboratory exercise is to learn to use some basic electrical measuring instruments in two different activities. In the first activity you will calibrate a power source using two different voltage-measuring instruments and test it for linearity of the output. In the second part of the lab you will use an ohmmeter to measure the resistance of a set of resistors and determine the errors associated with your measurements. You will also learn to calculate the standard deviation in the measurements, use the sum and product rule to calculate the uncertainty arising from the calculations, determine the percent uncertainty and percent error, and evaluate your results.Equipment
- Signal interface
- DataStudio software
- PASCO circuit board
- Connecting wires
- Resistors
- Multimeter
Procedure
Procedure A: Calibrating a Power Supply Using a Voltmeter
Please print the worksheet for this lab. You will need this sheet to record your data.
Figure 4: PASCO circuit board
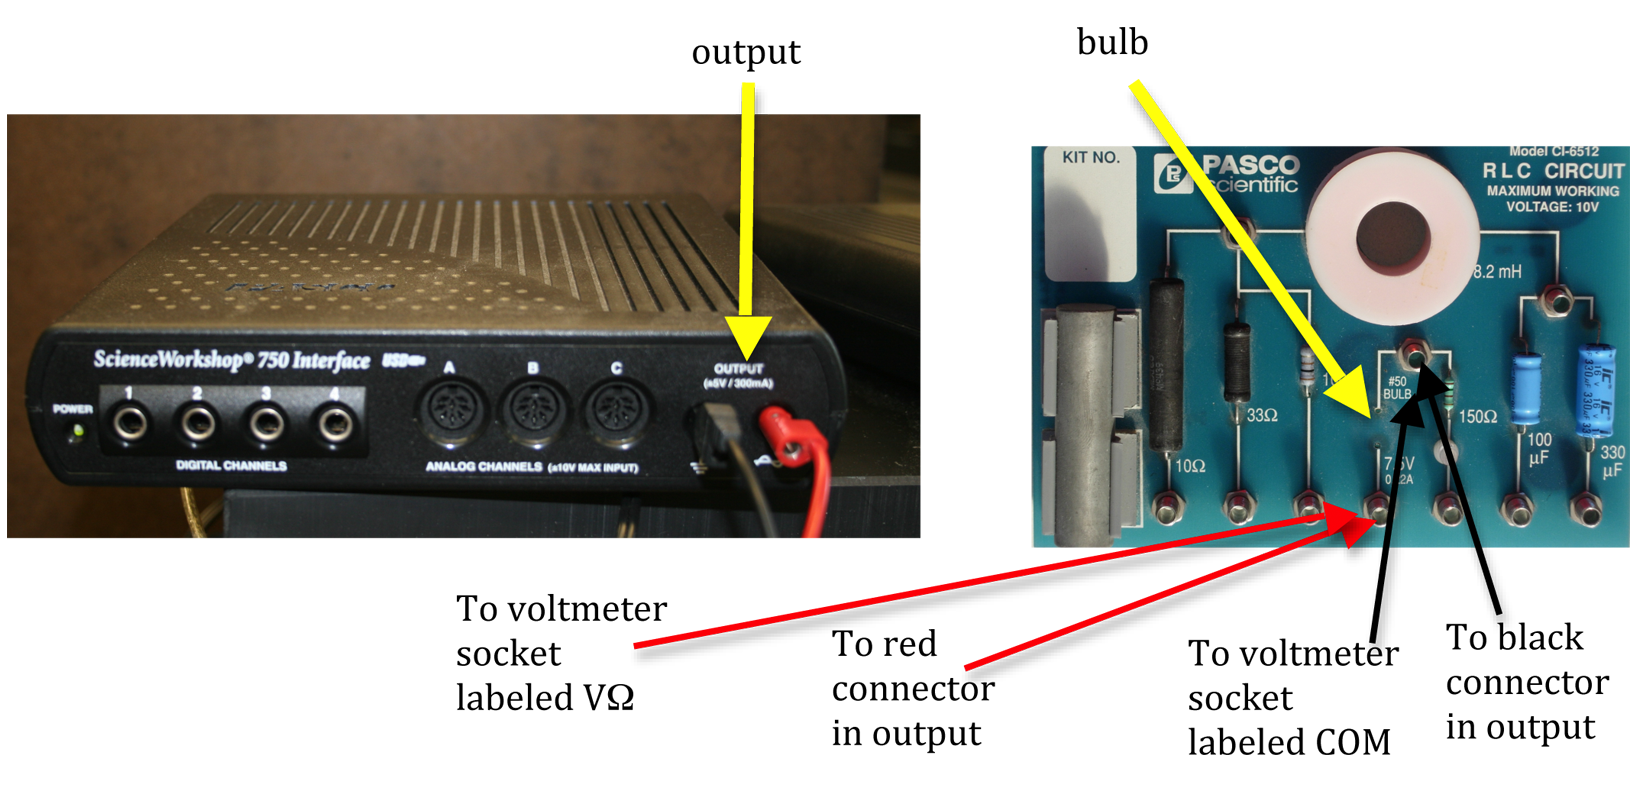
Figure 5: Signal interface and circuit board connections
1
Connect the red lead from the output on the signal interface to one side of the bulb on the circuit board.
2
Connect the black lead from the output to the other end of the bulb.
3
Connect the socket of the voltmeter labeled VΩ to one end of the bulb using a second red lead.
Connect a black lead from the socket of the voltmeter labeled COM to the other end of the bulb. This will enable you to measure the output voltage from the power source.
4
Make sure your voltmeter is set to read DC voltage. See Appendix K.
Checkpoint 1:
Ask your TA to check your circuit connections.
Ask your TA to check your circuit connections.
5
Open the DataStudio software appropriate for this lab. Fig. 6 shows the opening screen of the program for this lab.
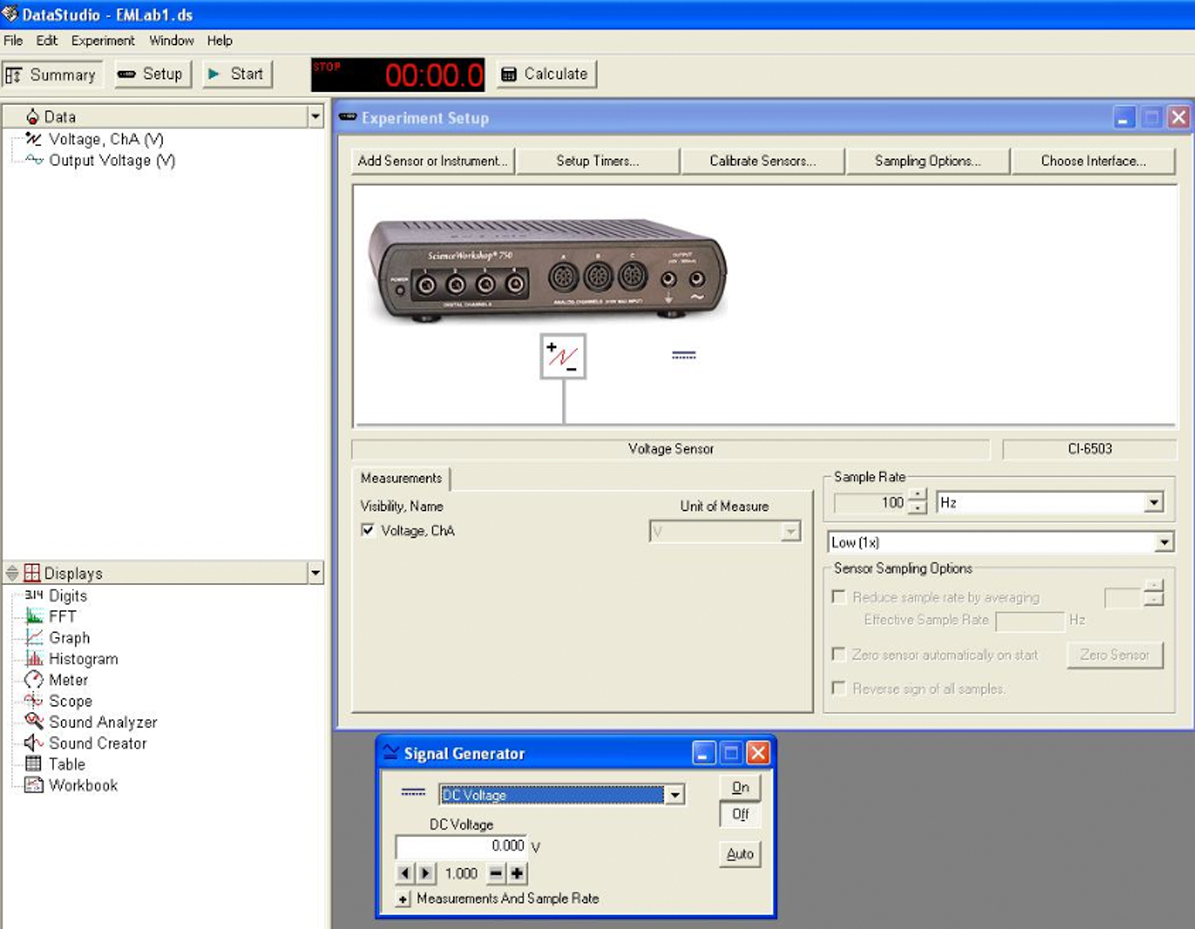
Figure 6: Opening screen of DataStudio software
6
Set the signal generator to DC voltage. See Fig. 7.
7
Make sure that the AUTO button is off and ON is selected.
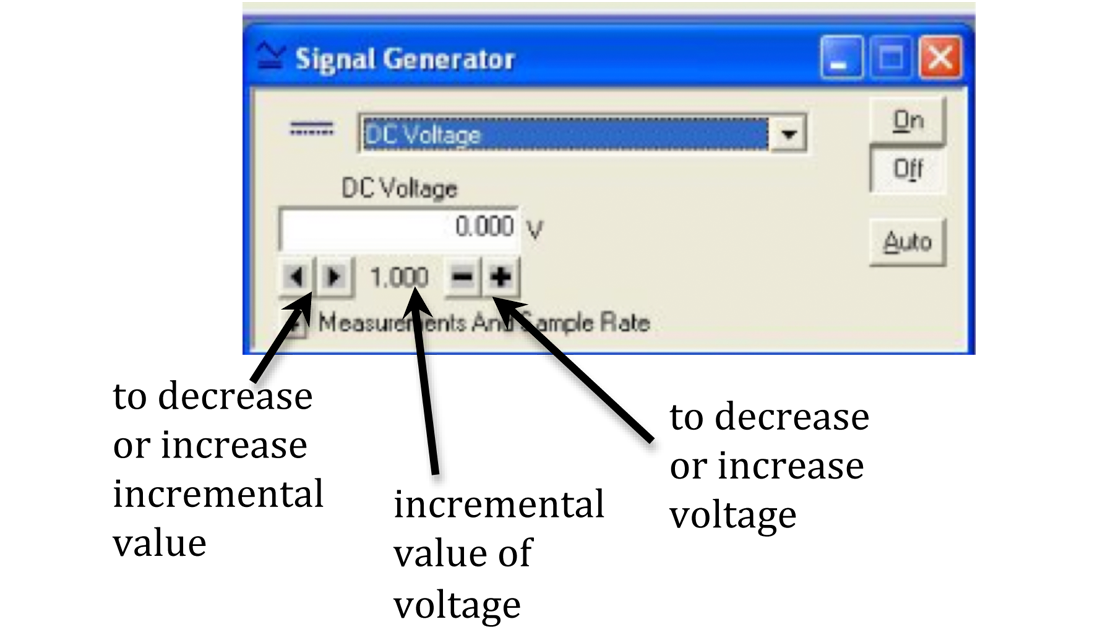
Figure 7: Signal generator window
You will use the minus and plus buttons to decrease or increase the voltage. The left and right arrows are used to set the incremental steps for the voltage change.
8
Set the incremental value to 0.5. See Fig. 7.
9
Use the minus and plus keys to set the voltage to the lowest value possible. Record this value as the output voltage in Data Table 1 on the worksheet.
10
Record the voltmeter reading as the measured voltage in Data Table 1 on the worksheet.
11
Increase the voltage in the signal generator window in steps of 0.5 V six more times for a total of seven readings.
For each setting of the signal generator, record the output voltage and measured voltage in Data Table 1 of the worksheet.
Be sure to notice the change in brightness of the bulb as you increase the output voltage.
12
Using Excel, plot power supply setting versus measured voltage. See Appendix G.
Checkpoint 2:
Ask your TA to check your table values, graph, and calculations.
Ask your TA to check your table values, graph, and calculations.
Procedure B: Calibrating a Power Supply Using a Voltage Probe
13
The connections are the same as in Procedure A except for the signal interface. Remove the voltmeter connections VΩ and COM.
14
Connect the double lead voltage probe to the analog channel A on the signal interface.
15
Connect the other ends of the black and red leads of the voltage probe to the two ends of the bulb on the circuit board.
16
If the digits window is not open, double-click Digits on the task bar on the lower left side of the screen. See Fig. 9 below.
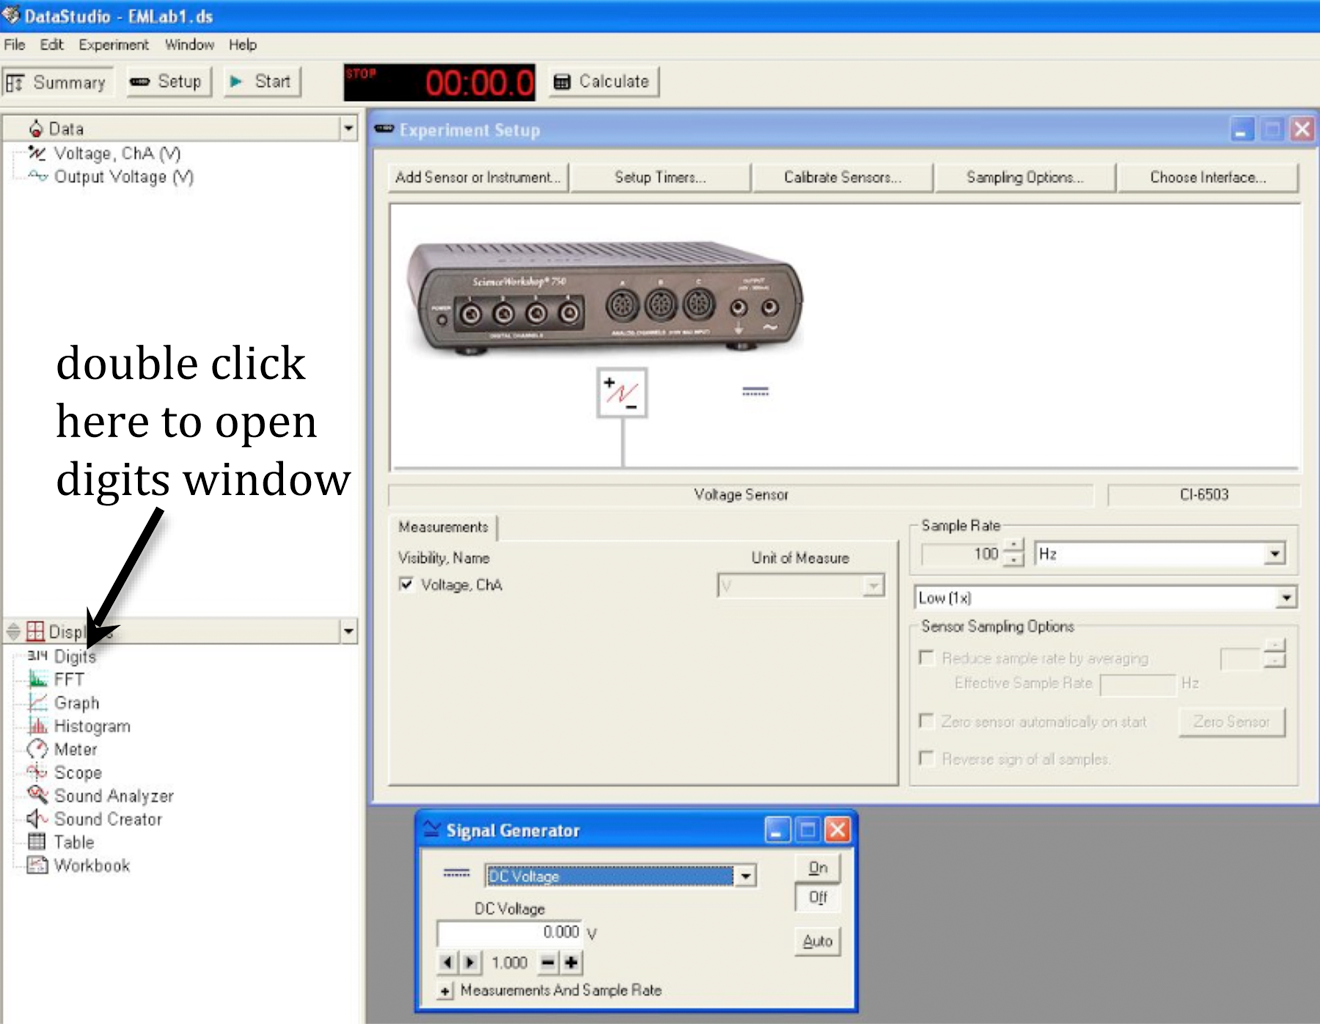
Figure 9: Opening the digits window
17
Drag volt channel A to digits.
18
Use the same set of output voltages as in Procedure A.
19
Click START and read the voltage on the digits window for each value of the output voltage of the signal interface. Record these values as the measured voltages in Data Table 2 on the worksheet.
20
Using Excel, plot power supply setting versus measured voltage.
21
Compare this result with that obtained using the voltmeter in Procedure A.
Checkpoint 3:
Ask your TA to check your table values, graph, and calculations.
Ask your TA to check your table values, graph, and calculations.
Procedure C: Resistance Measurement and Standard Deviation
Do not mix the resistors of one set with another. You are given an envelope with 10 resistors and a second envelope to place the resistors in as you measure them.
22
Set the multimeter for measuring resistance. See Appendix K.
23
Using the multimeter measure and record the resistance of eight of the resistors in the set in Data Table 3.
24
Using Excel, create a spreadsheet to enter the values of the resistors and calculate the average of the eight readings. See Appendix E.
25
Determine the standard deviation of your measurements and record this on the worksheet. See Appendix E.
Checkpoint 4:
Ask your TA to check your table values and calculations.
Ask your TA to check your table values and calculations.
Procedure D: Resistances in Series and Parallel
26
Connect one end of the first resistor to one end of the second resistor using a connecting wire. This is a series combination of the two resistors. See Fig. 10.
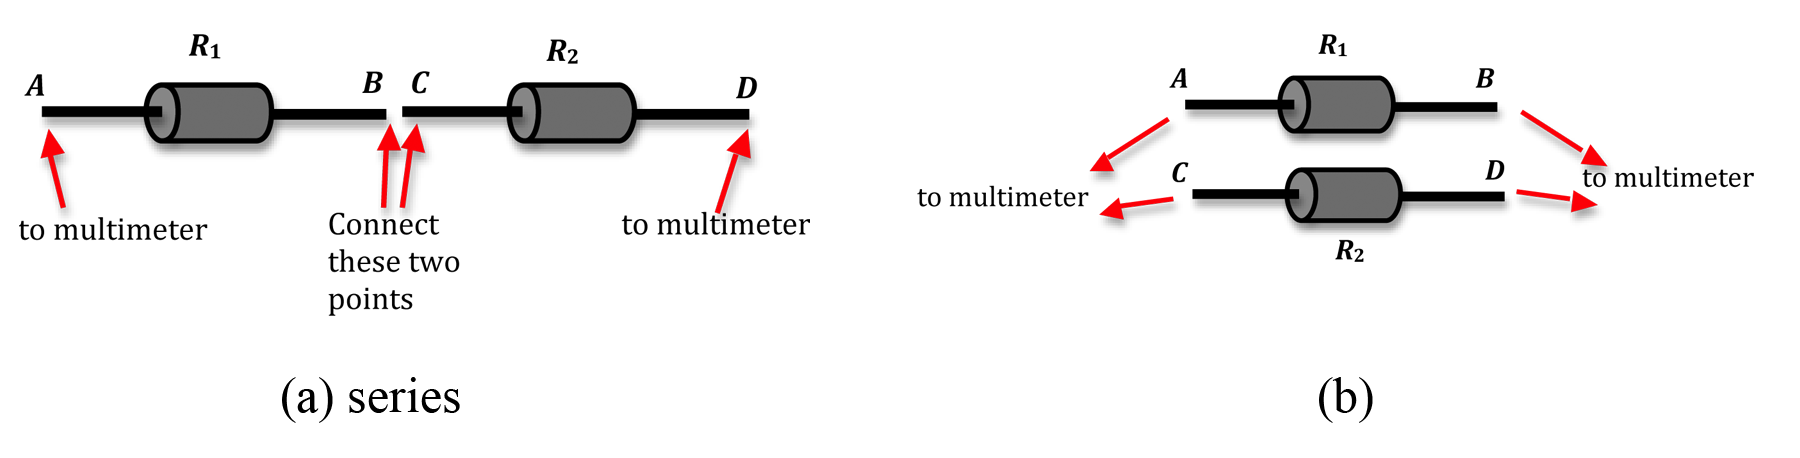
Figure 10: Connections for series and parallel combinations
27
Measure the resistance of this combination and record this on the worksheet.
28
Repeat steps 26 and 27 for other pairs of resistors in your set. You should have eight pairs for which you have measured the resistance of the series combination.
29
Use Excel to calculate the average equivalent resistance and the standard deviation. Record these values in Data Table 4 on the worksheet.
30
Calculate the percent uncertainty in your average value. See Appendix B.
31
Calculate the theoretical uncertainty of the series combination using the values of the individual resistances determined from the color code and the manufacturer's tolerance. See Appendix C.
32
Compare this calculated value with the experimental value of Rseries
from step 29.
33
Repeat steps 27 through 32 for the parallel combination of resistances and enter these values in Data Table 5.
Checkpoint 5:
Ask your TA to check your table values and calculations.
Ask your TA to check your table values and calculations.